Tuesday, March 25, 2014

3D Visualization of Manhattan using QGIS Plugin

GIS Blogger Anita Graser, aka Underdark, has created a nice visualization using the QGIS2threejs plugin, including an interactive web-based version.  I won't repeat the instructions listed on her blog, but I will make a few suggestions as I go along. Her eloquent map features buildings extruded (constant height), trees, and some elevation changes. Feeling inspired, I thought I would give it a quick try.

If you just want to see the visualization, visit: http://webmapexamples.net/3DExample/Cityscape.html

Note: You will need Firefox, Chrome, or Internet Explorer 11--basically a Web-GL capable browser to view the visualizations.

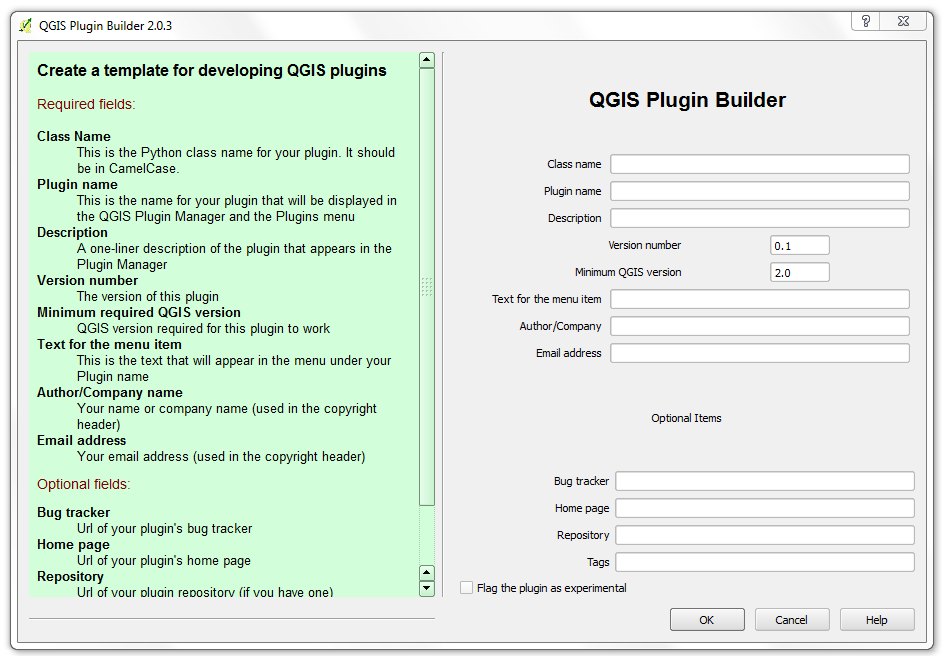
WebGL is an API that allows for 3D visualizations to be displayed in a web browser without additional plugins. So, users won't need to install anything to view your product.  The threejs plugin is a JavaScript library that helps to keep everything neat and tidy.  For examples of threejs projects, check out this website: http://threejs.org/ which is filled with examples of featured projects.  Believe it or not, the projects you will see below consist of five files that take up less than 5 megabytes of storage.

Tip #1: Using a shapefile or digitizing a boundary for an extent can help to speed the project along and keep the look of your map consistent.  In QGIS, you can do this using the AutoTrace plugin.

For the project, I focused on Manhattan from Central Park down to just below times square.

Below is what the project looks like in QGIS.  I left the bound on to show the project area.  I used a building footprint shapefile that contained height from New York City's Open Data Portal.  Please note: This file is large ~ 180 MB.  In addition, there is a basemap from Open Street Map using the QGIS plugin, and a DEM.  You can also add other point, polygon, or line features to your 3D map.  I have chosen to stay with just buildings.  I color-coded the buildings based on height for effect (redder is taller).  Click on any of the screenshots to magnify them.

Project area and files 
Running the plugin is rather quick.  The result is five files exported to a folder of your choosing.  The contents of the folder can be placed into the root or public directory of web hosting service to publish to the web!  Of course, you can also double-click the resulting *.html file to open it on your desktop--please note some broswers may try to block you from opening it.  So right-click, and choose open with a friendly browser like Chrome or Firefox.

Tip #2:  I created a new variable to half the building heights.  Otherwise, the tall buildings of NYC barely fit in the web browser and makes viewing awkward and challenging.

You can view the visualization at: http://webmapexamples.net/3DExample/Cityscape.html

When you first open the html file, the view will be oriented the same way you have the files in QGIS.  If you have not used 3D viewers before, you can navigate using the left and right mouse buttons and wheel to  pan, rotate, and zoom.  Try not to make sudden moves with the mouse because it is easy to get disoriented. Refreshing the web page will send you back to the starting view.
3D Visualization of Manhattan.  Redder buildings are taller.
As you zoom and pan, you can bring areas into closer view.  Here looking down 7th Avenue in NYC.

A closer look: From Central Park down 7th Avenue
Lastly, an overhead view of Times Square...
Can you see where the ball is dropped on New Year's...One Times Square?
Overall, the plugin was fast and easy to use.  Not only can it be used for creating cityscapes...You could also visualize chloropleth maps in 3D, for example.  Performance in browser was smooth.  I saw memory usage similar to what Underdark reported, around 1.6 GB of RAM.  This is reduced if you do not constantly hold down any of the mouse buttons--occasionally releasing as you view.

Update #1: If the basemap is not loading, and you see a black rectangle, reload/refresh your browser once or twice and it should appear!

Update #2: Forgot to mention: Since almost 2 GB of RAM is used--this prevents viewing the maps on a mobile device, since most mobile devices don't have or max out at 2 GB.  I have gotten them to load in Android after a long time, but you won't be able to manipulate them (zoom, pan, rotate,etc.)

Friday, March 21, 2014

Creating QGIS Plugins in Windows: Getting Started

I have started thinking about creating a plugin or two for QGIS, but I ran into a few hurdles along the way... I am not a programmer (and maybe you are not either!), but I know a few basic skills, so keep that in mind. I am working on creating QGIS plugins on a Windows 7 PC.  Many programmers likely use a Linux distribution.

First, there are several tutorials on the web but I would start with this one.  To start, in QGIS navigate to the "Plugins" tab and download the Plugin Builder, if you don't have it installed already. The plugin builder creates a template with important information for your plugin as well as the needed files.  Click on any of the screenshots to magnify them.

QGIS Plugin Builder 2.0.3
The text in green and the link to the tutorial explain what each of the fields mean and does for your plugin. A folder with the necessary files will be created.  Remember the file path.

The next step is to compile the plugin files.  This was the first hurdle.  Eventually, I found a post with a solution.  Double-click the OSGeo4W icon on your desktop.

  1. At the command prompt, point to the folder where your plugin is located.  Example:  cd: C:/Users/yourusername/.qgis2/python/plugins/pluginname (in this example CalculateArea is the name of the plugin).  You will need to substitute the fields highlighted in red.
Point to the directory where you plugin is located.
  1. Next, type: pyuic4 -o ui_pluginname.py ui_pluginname.ui and press Enter
  2. Lastly, pyrcc4 -o resources.py resources.qrc and press Enter
Compiling the Resource and UI files

Then follow the steps for deploying and testing.  After installing the plugin from the plugin tab, you should be able to see it in the tab along with any other plugins you have installed.  Click it and the basic plugin window will appear!  You should be able to install your plugin in QGIS and see its name.
The basic plugin window with the name of your plugin
Lastly, time to start writing some python. You can download a viewer/editor like gedit.  Open up the file named pluginname.py and you will see a lot of the basic skeleton coding already written.

Viewing and editing python code from the QGIS Plugin Builder 
A few parting thoughts:  Be sure to search the QGIS repositories to see if someone has already created a plugin for what you are thinking of doing.  Borrow code from other plugins, which have been validated, to help speed the process along.

Thursday, March 13, 2014

An Epic View with NASA's Worldview

In an ever-changing world, having a global view is extremely important.  NASA has developed several website/tools where you can view and download up-to-date global remote sensing data.  NASA's Worldview is one of them.  If you are looking for a quick example of its practical value, take a look at last fall's forest fires in the western U.S.
 "Most of the 100+ available products are updated within three hours of observation, essentially showing the entire Earth as it looks 'right now'. This supports time-critical application areas such as wildfire management, air quality measurements, and flood monitoring."- NASA Worldview Website
Of note, browsing on a tablet or smartphone is supported.  There is a layered slider for time, so users can choose the year, month, and day. Selecting dates in some websites can be painful.  However, this slider is intuitive, quick, and easy to use--much more so than those pesky calendar pages some users are forced to navigate.  Users also have several base maps to choose from in addition to the rest of the layers.  There is a great "About" page and brief "Tour" available.

Global Land Surface Temperatures/Day from MODIS, 17 July 2013
A few basic social features are built-in.  The website has buttons for saving links to certain views and taking screenshots.  There are lot of different instruments and views but everything is well-labeled. A few different band combinations can be selected with one-click for easy viewing.  This is especially important for looking at vegetation and agriculture, for example. 

You can also check out recent scenes from Landsat 7 at: http://earthnow.usgs.gov/ or Landsat 8 at: http://landsatlook.usgs.gov/.  If you are interested in NASA's open data policies, a quick overview can be found at: http://science.nasa.gov/earth-science/earth-science-data/data-information-policy/