Showing posts with label Linux. Show all posts

Sunday, February 1, 2015

Crime Analytics for Space-Time (CAST)

Crime Analytics for Space-Time (CAST) - alpha (2013) is a free and open-source cross-platform program (Windows, Mac OSX and Linux) designed "to detect spatial patterns and trends in crime data."

CAST is a nifty piece of software that combines key functions of other programs from the ASU GeoDA Center with a greater emphasis on temporal trends.  It even allows you to view data by calendar days, months, and years.

What you will need...
All you need is a shapefile of projected crime incident data and any boundary files (posts, census tracts, blocks, etc.).  To perform some types of cluster analysis, you will also need to aggregate your data.  If all you have is a *.csv, you can use QGIS to crate a shapefile file and save it for importing into CAST. There is sample data from San Francisco available here.

Check the format of your date field
If you are having trouble with using your data's date fields in CAST, use QGIS's field calculator to create a new variable with an output field type of "Date." Next, use "Conversions" and "to date" under the function list, and make sure the variable you enter is in the format "YYYY-MM-DD".  So, the expression should read:  todate( "Date Field" )
  • Make sure to create separate fields for date and time--rather than one single field. 
  • I tried a couple different formats but this format worked. 
  • In CAST, you will be able to select your date field. 
CAST can do a lot!
In the "Tools" menu, you can create a grid and save it as a shapefile.  Under "Table", you can view attribute data for your shapefile. The "Weights" menu allows you to create spatial weights and view a connectivity histogram, like in GeoDA.  The "Map" menu allows you to symbolize polygons by several different criteria.  The real fun comes in the last four menus: Calendar Map, Cluster Map, Time, and Explore.

Calendar Map + Dynamic Map
One of CAST's interesting features is combing a calendar with the number of events and a map.  You can add shapefiles and layer them, although a bit tricky by clicking on each. Below are few examples using homicide data from Open Data Philly.
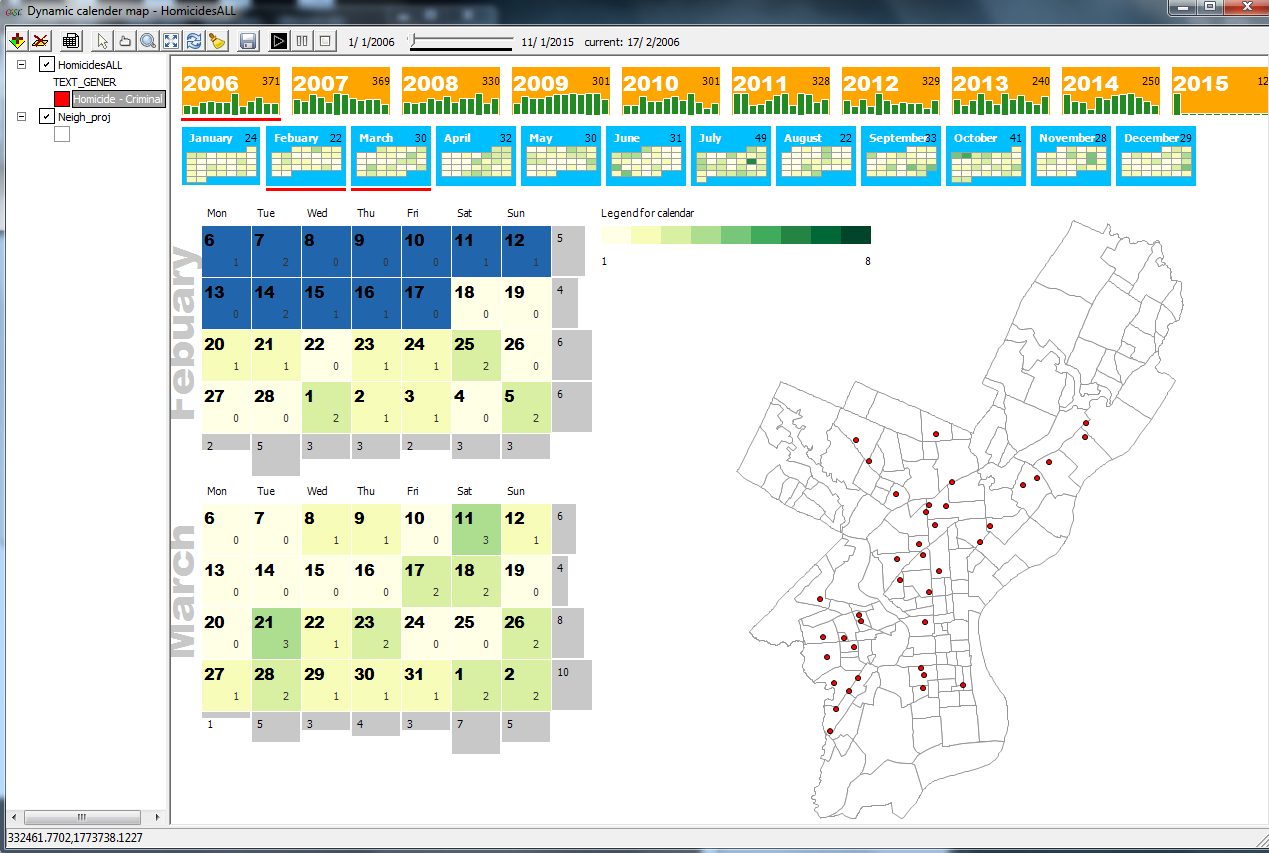

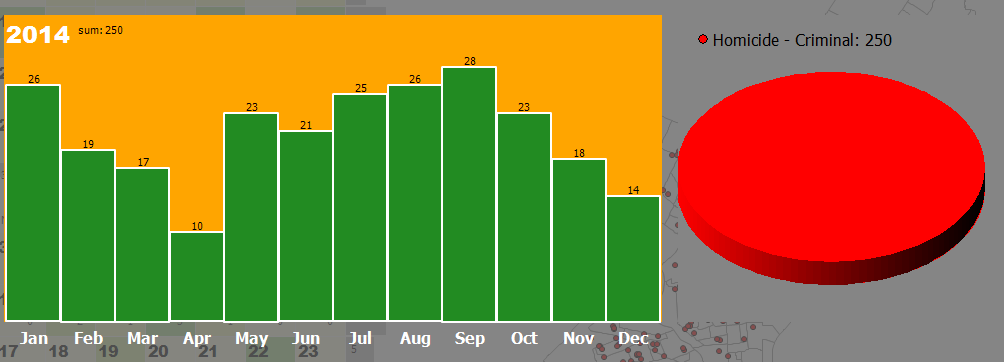
A calendar and map of homicides in Philadelphia starting in 2006.
Clicking a calendar will bring up a bar and pie graph (which can show a
breakdown if there is more than one category of crime/event in your data).
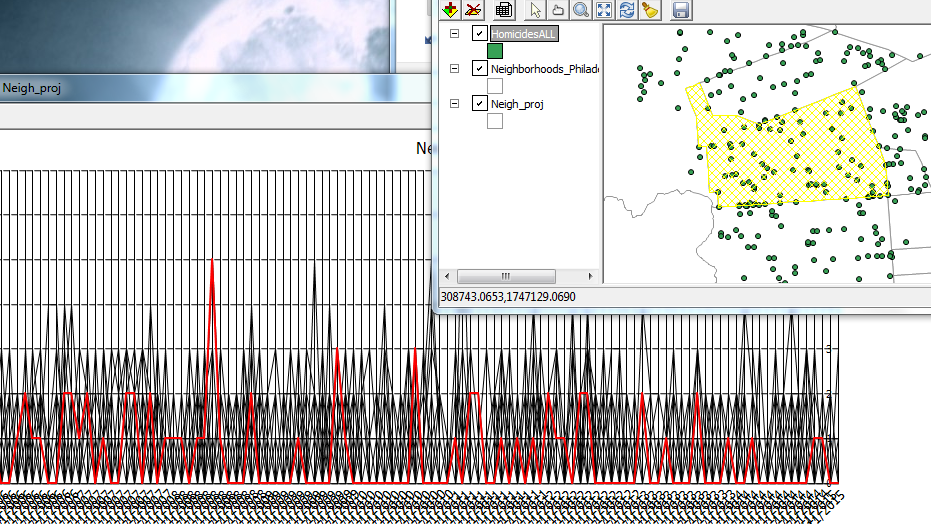
Graphs and maps are linked in CAST, so clicking on a feature or peak in a graph will highlight the selected features.
Like other ASU software, all graphs and maps are linked. Here one line was selected,
which represents one neighborhood, and the corresponding area on the map is highlighted.
Cluster Map
You will find a lot of tasks that are identical to GeoDA here plus some dynamic density maps.

Time & Explore
Trend graphs area available here as well as standard graphs like a histogram, scatterplot, and boxplots.

In sum...
Looking at patterns over space and time is difficult, but CAST can help.  Unfortunately, you cannot save a session in CAST so be sure to keep track of what steps you perform.  Limit your data to the time period of interest. I would not recommend adding huge point shapefiles.  Lastly, I was not able to save a movie/*.gif of animations over time, but if I figure it out, I will update this post.

For more information:
CAST Manual

Tuesday, November 4, 2014

QGIS on Raspberry Pi

Raspberry Pi is a low-cost credit-card sized computer that has gained notoriety for programming, education, and a wide variety of other projects. In this post, I will talk about using QGIS with Raspberry Pi as hardware.

I will cover the different models for Raspberry Pi, which one you should use, other accessories, installing an operating system (OS), and more!  If you have any suggestions, please let me know in the comments section below.

Where to purchase
Raspberry Pi can be purchased online through Amazon.com and other online retailers.  Some specialty electronic stores, like Micro Center, and hobby shops also carry it in stock.  Expect to pay more in physical stores than online.  Also, it can be easier to find accessories online than in brick and mortar stores, where I had to hunt through bins!

What to purchase
There are two models of the Raspberry Pi: Model B+, the newest version, and Model B.  Model B+ carries a number of significant improvements over Model B including: More USB ports (4 vs 2), Micro SD slot for storage, lower power consumption, and better audio.  Both models also sport an HDMI connection.  The Model B+ is also organized better with an improved layout.  Both models sport the same processor and 512 MB of RAM.

Comparison of Model B+ and Model B, Raspberry Pi
I purchased a Raspberry Pi Model B+ Starter Kit ($60 USD/48 Euros/6739 Yen) since it contains nearly everything you need to get started including a case to protect your device, power supply, Micro SD card with SD adapter (several OS already installed), and a brief user's guide.  (Note: the Micro SD card needs to be removed to completely close the case).

Additional Items
I purchased an inexpensive card reader to be able to copy files from my computer onto the Micro SD card that I will use in the Raspberry Pi. I also got a Samsung micro SD card PRO with a larger capacity (16 GB), faster read speeds up to 90 MB per second, and write speeds of 50 MB per second ($20 USD/ 6 Euros /2246 Yen).

Lastly, I purchased a Wi-Pi, a wireless adapter ($14 USD/11 Euros/1572 Yen) designed for the Raspberry Pi.  Already on hand, I have a regular sized keyboard and mouse, a monitor (or TV can be used), an array of cables (USB and HDMI) and as an alternate: a small wireless keyboard with mouse pad.

Instructions
There are several posts on installing QGIS on Raspberry Pi including one on StackExchange.

Sources of Frustration
Minor: The Raspberry Pi may not detect your monitor or TV size and resolution at first.  You can also edit a config file to match your desired characteristics.

Major: I had issues with Debian, upgrading from Wheezy to Jessie, and being able to re-boot.  From Goggling, the issues I had are known - and not new.

Success or Failure?
I was able to install QGIS on the Raspberry, see below for a screenshot, but it is slow. I was also able to install plugins.
Success but was it worth it?

Worth the Effort?
It will take at least 2-3 hours to go from Wheezy to Jessie and install QGIS.  Expect to spend more time, if like me, you are new to Linux-based systems, you run into difficulties, or need to start from scratch.  For the moment, I won't be using my Raspberry Pi for GIS, but I may check-back in on it later.  I think I will be using the Raspberry for its more typical uses.

Tuesday, August 5, 2014

OpenJUMP for Editing Geometry and Attribute Data

OpenJUMP is a neat little program for editing geometry and attribute data in GIS-related files.  It is free and open source, its project source code can be downloaded.  A full list of its features can be found here. Anyone that has gotten deep into a GIS project knows that inevitably attribute or geometry data will need be edited.  


OpenJUMP can be installed on Windows, Mac OSX, or Linux.  Instructions for installation are found on the project's wiki:  http://ojwiki.soldin.de/index.php?title=Installation#Requirements.

After installing and opening the program, you will find a neat and organized interface.  Setting up workspaces/a project space is easy and smooth, unlike other programs that I have used.  There is a very nice and functional menu bar at the top.  Buttons below provide for basic functions that are common in GIS-related programs.

You will find a lot of functionality in the "Tools", "Rasters"," and Plugins on the top navigation bar.  For example, in Tools you will be able to:
  • Do spatial and attribute queries
  • Proximity/buffer analysis
  • Create statistics about the layer and featurs
  • Generate grids,etc.
  • Perform quality assurance (QA)
  • Edit geometry data
  • Edit attribute data
Also, right-clicking on a loaded layer, will also bring up a wide variety of actions to be performed.

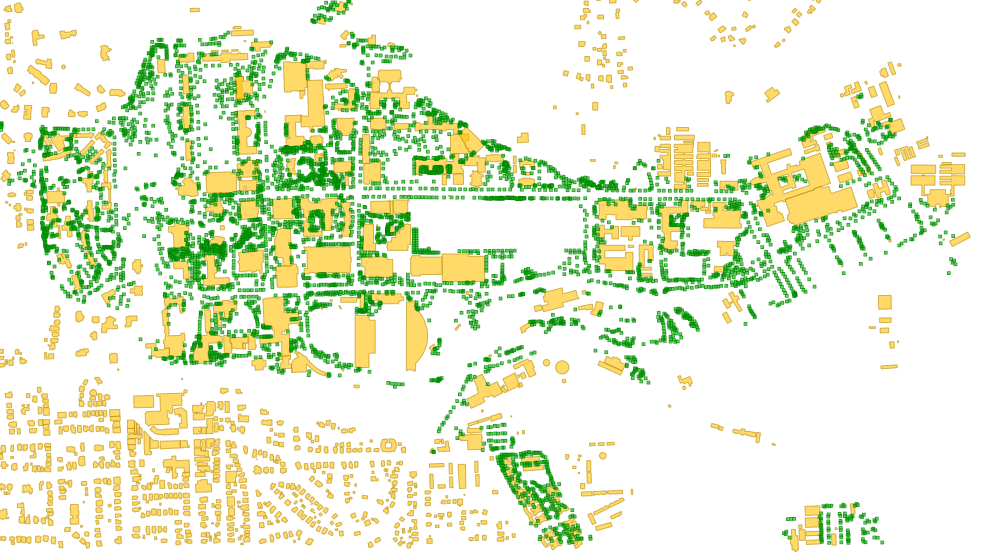
First, our map.  Below is a map of shapefiles loaded in OpenJUMP for Cornell University's campus buildings and a shapefile of trees from an inventory in 2012. Click any of the images below to see them in a larger version.


Cornell University Campus and Tree Inventory.
Editing Attribute Data

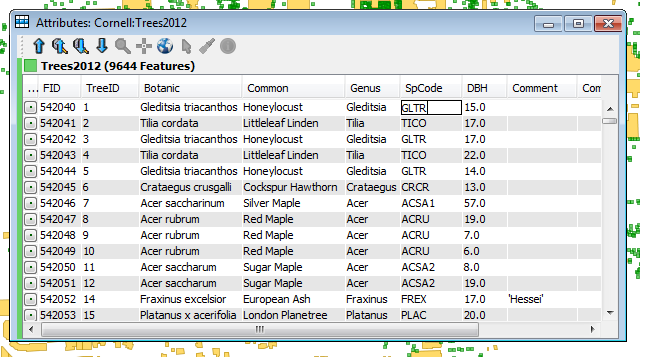
Below is a screenshot of the attribute table in OpenJUMP.  Right-click in the table, and selecting "Editable" allows users to edit attribute data and also brings up an additional Editing Toolbar for editing geometry.

An attribute table for our tree inventory file.
Editing Geometry Data

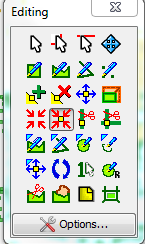
At right: the Editing Geometry toolbar.
Editing geometry toolbar includes the ability to:

  •  Select features, parts, and linestrings
  • Draw rectangle, polygon, linestring, and points
  • Invert, delete, or move a vertex
  • Scale selected items 
  • Snap vertices, snap vertices to selected vertex, split lines, node lines
  • ...and about 12 other actions

So, let's say I wanted to edit a building.  I would right-click on the shapefile and click "Editable" and then make the change, say using the delete vertex tool.  Your cursor becomes a small red x and pulsates/sends a ping to let you know that the action has been completed.

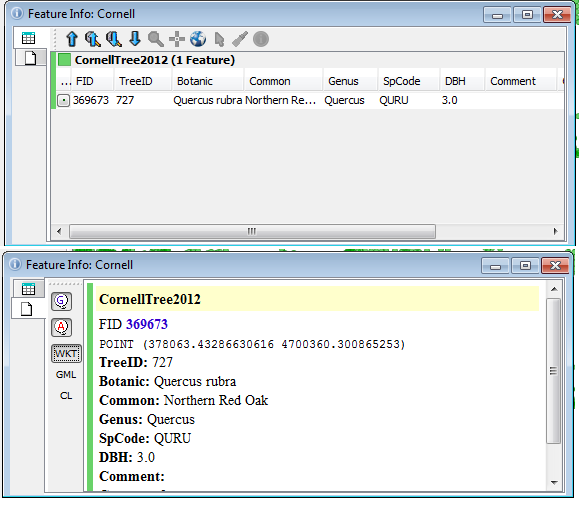
Lastly, a quick word about using the Feature Info Tool / identify tool.  With it, you have several different ways to display information about select features.  The screens below show information for a tree shapefile.

The Feature Info Tool allows you to view attribute and/or geometry data
with a few clicks of a button, it can be viewed in different formats.
OpenJUMP has a lot of interesting features, including exporting images as scaleable vector graphs or *.svg. Be sure to check out OpenJUMP at: http://www.openjump.org/.

Friday, March 21, 2014

Creating QGIS Plugins in Windows: Getting Started

I have started thinking about creating a plugin or two for QGIS, but I ran into a few hurdles along the way... I am not a programmer (and maybe you are not either!), but I know a few basic skills, so keep that in mind. I am working on creating QGIS plugins on a Windows 7 PC.  Many programmers likely use a Linux distribution.

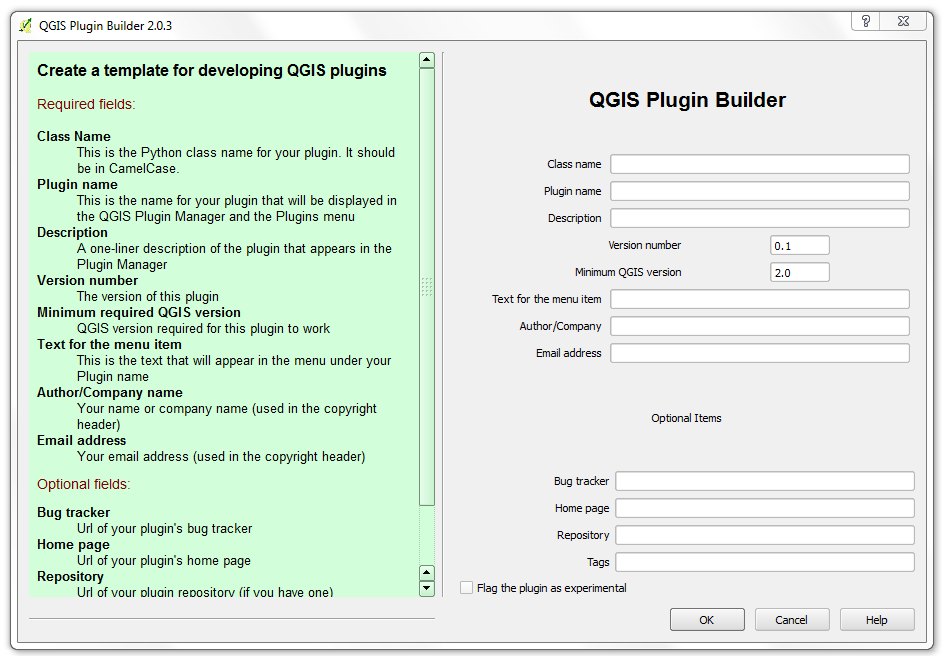
First, there are several tutorials on the web but I would start with this one.  To start, in QGIS navigate to the "Plugins" tab and download the Plugin Builder, if you don't have it installed already. The plugin builder creates a template with important information for your plugin as well as the needed files.  Click on any of the screenshots to magnify them.

QGIS Plugin Builder 2.0.3
The text in green and the link to the tutorial explain what each of the fields mean and does for your plugin. A folder with the necessary files will be created.  Remember the file path.

The next step is to compile the plugin files.  This was the first hurdle.  Eventually, I found a post with a solution.  Double-click the OSGeo4W icon on your desktop.

  1. At the command prompt, point to the folder where your plugin is located.  Example:  cd: C:/Users/yourusername/.qgis2/python/plugins/pluginname (in this example CalculateArea is the name of the plugin).  You will need to substitute the fields highlighted in red.
Point to the directory where you plugin is located.
  1. Next, type: pyuic4 -o ui_pluginname.py ui_pluginname.ui and press Enter
  2. Lastly, pyrcc4 -o resources.py resources.qrc and press Enter
Compiling the Resource and UI files

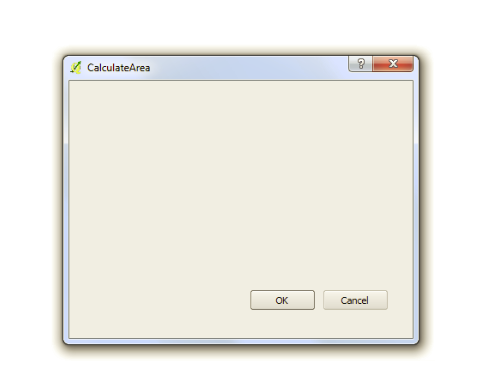
Then follow the steps for deploying and testing.  After installing the plugin from the plugin tab, you should be able to see it in the tab along with any other plugins you have installed.  Click it and the basic plugin window will appear!  You should be able to install your plugin in QGIS and see its name.
The basic plugin window with the name of your plugin
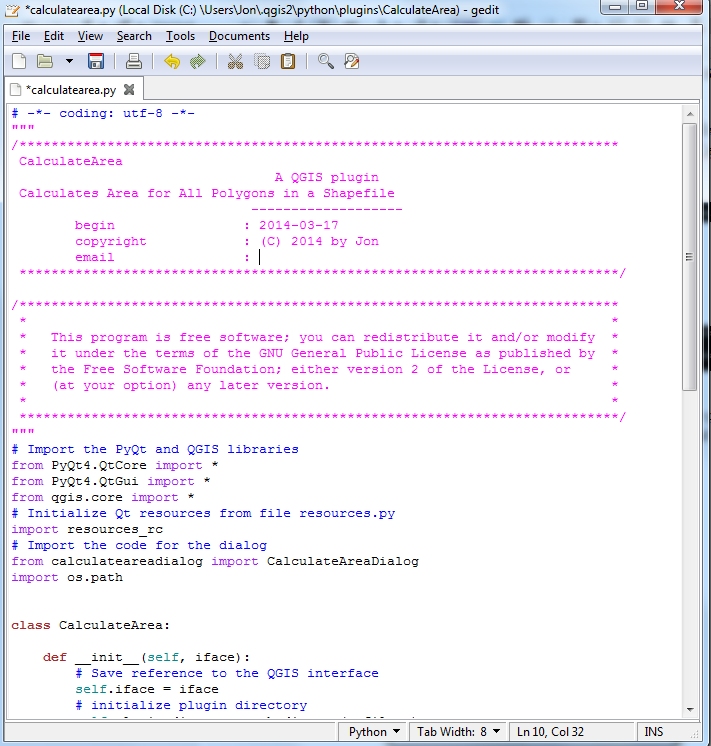
Lastly, time to start writing some python. You can download a viewer/editor like gedit.  Open up the file named pluginname.py and you will see a lot of the basic skeleton coding already written.

Viewing and editing python code from the QGIS Plugin Builder 
A few parting thoughts:  Be sure to search the QGIS repositories to see if someone has already created a plugin for what you are thinking of doing.  Borrow code from other plugins, which have been validated, to help speed the process along.

Friday, July 20, 2012

Non-GIS Open Source, Worthy Companions

Do not look at the title twice!  Yes, this post is about non-GIS open source software.  However, these open-source programs make great companions to any analysis. 

For example, you may find the need for a traditional statistical software package. R Statistical Software can aid in importing, analyzing, and cleaning your data.  You can perform traditional statistical analyses.  There's even a spatial package, although you will better off sticking with open source GIS programs like GRASS or QGIS.  A good overview of its spatial package can be found here.

Want to examine social networks?  Then, Gephi's great!  I just analyzed my Facebook network in only a few minutes after following a tutorial.  In addition, Gephi has features and plugins to help you map geographic data. 
   
At some point you may also need Python.  Editing and organizing code, then give Notepad ++ a try.

A some point you will have to compress files, then 7-zip is a sure thing.  You may want to playback some videos or animations and VLC Player works great.

GIMP is a image maniupulation program similar to photoshop.  You can see an example of combining GIS with GIMP on a great GIS blog.

You will probably want to type up your results or make a few "PowerPoint" slides...so there's Open Office and the Libre Office implementation. If you need a standalone pdf creator, then there's PDF creator.

Lastly, if you ever want to venture away from Windows or other operating systems, there's Ubuntu--an easy installation of Linux.  Be sure the open-source or for-fee programs you want to run have a Linux version before making the switch.  Naturally, many open source programs have a Linux version but some do not.