Showing posts with label USGS. Show all posts

Saturday, August 1, 2015

Tutorial: Side-by-Side Maps in QGIS Print Composer

Step #1: Open New Print Composer
QGIS print composer can be a bit daunting and confusing. It is equivalent to the Layout View in ArcGIS, where users can setup their map for printing and publication. One common task is to create side-by-side maps, to compare imagery, choropleth, or other types of maps.  I looked but could not find a good tutorial with screenshots, so here we go!


Purpose
To create three side-by-side maps of different band combinations from Landsat 7 imagery of the Salton Sea. The maps will be exactly the same size.  The different band combinations were created using the Orfeo Toolbox->Image Manipulation->Images Concatenation and selecting various band combinations.

Step #1:  For starters...
I've started by just selecting the natural color view (bands 3-2-1).  Go to the the Project Toolbar in the upper left-> New Print Composer. 

  • You can also can the page layout to landscape or portrait, depending on whether your map series will be laid out horizontally or vertically.

Step #2:  Creating the first map

Click the "Add New Map" button, highlighted in red. and draw an area for your map on the blank page.  For best fit of your image, be sure in QGIS to have zoomed into an area of interest. 


  • Then on the right hand side of print composer, select "Item Properties" and click the long button for "Set to Map Canvas."
After Steps #1-2

Step #3: Add the second map

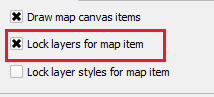
Before adding the second map to the right, scroll up in "Item properties" and check the box for "Lock layers for map item."  The click on the existing map in print composer and copy and paste it. On this second map, be sure to uncheck the box we just checked: Uncheck "Lock layers for map item."


  • In QGIS, add the next layer, in this case I added a false color image from bands 4-3-2.
  • Go back into Print Composer and hit the blue refresh button.
  • The second map should display the false color image and the first map should remain natural color.
After Step #3

Step #4: Repeat for the third map
Before copying and pasting, make sure to check the "Lock layers for map item" box.  Copy, paste, and then uncheck this for the third map, with the last set of band combinations (7-4-2).  The final map appears below.
Click to enlarge the map.
Three side-by-side maps, equal sized, and the same scale.
For more information:
You can find additional tips about using the map composer from multiple frames and different layers in this discussion on StackExchange: http://gis.stackexchange.com/questions/45174/how-to-handle-multiple-map-frames-with-different-layers-in-one-print-layout

Wednesday, February 25, 2015

ESRI's Open Data vs.Data.gov

ESRI recently announced its open data website (http://opendata.arcgis.com/), which was in beta in mid-2014, so I decided it was a good time to take a look.  More and more open data is being published in a variety of places, by different organizations.

I thought it was only fair to make some comparisons. Because ESRI's user base and audiences are large, I decided the best comparison is Data.gov.  The only drawback is that Data.gov has been in existence longer.

Of course, open data is important regardless of the platform.  Moreover, open data can be imported into any free and open source GIS.
"[Open data's] impacts include... cost savings, efficiency, fuel for business, improved civic services, informed policy, performance planning, research and scientific discoveries, transparency and accountability, and increased public participation in the democratic dialogue." - Data.gov
One big difference between the sites is ESRI's contains lots of data from States vs. federal (state, and local) data found in Data.gov.  ESRI touts that it works with more than 380,000 organizations across the globe, so more open data is on its way!

A table comparing ESRI's Open Data vs. Data.gov
One big advantage of ESRI's Open Data page is being able to view geographic data in your browser immediately and even see some attribute data.

Data.gov's metrics pages are really neat including one on data sets published by agency by month: . Most data sets come from NOAA and USGS, which can be accessed in several different ways.   Obviously, a lot of the pages linked from Data.gov either use ESRI formats or are driven by ESRI products.  For developers it is also important to note that Data.gov has challenges/competitions. So be sure to check their website and social media! 

Data.gov helps you get started with browsing categories.
Currently, Data.gov has more data sets but it will be interesting to see how much ESRI can catch-up in the months to come.  It is a win-win situation for any data scientist or GIS analyst.  As open data sites get larger, they can become harder to search and navigate.  In sum, both sites will have to keep innovating to help bring out the best in open data and analysis.

Monday, November 17, 2014

GeoNames: 8 Million-plus Placenames for Free

GeoNames is an open-source geographical database, which you can download, that contains information on many types of features, in various languages, has attribute data (such as elevation) and comes with lat/long coordinates.

You can see a breakdown of the number of features by country at: www.geonames.org/statistics/.  In addition to being able to download the data in bulk, GeoNames also has collaboration and editing features similar to other open mapping ecosystems.

Example: Populated Places Around Mt. Everest
Before downloading,  open the Readme: http://download.geonames.org/export/dump/readme.txt to make sure you are grabbing the correct files.  It will also describe the column names and send you to a few other webpages for reference information.  For example, you will also want to read through the feature codes at: http://www.geonames.org/export/codes.html

Populated places (PPL) from GeoNames.  Click to enlarge.
Other data sources: USGS (DEM) and Natural Earth (Roads, Rivers,etc.).
There are also free and premium web services: http://www.geonames.org/commercial-webservices.html

Editing
GeoNames also allows users to add and edit data.  A screenshot of the interface for Mt. Everest:

Add/Edit Interface
You can also view a history of edits:
Wikipedia Map
Lastly, you can even view Wikipedia entries on an interactive map:

Markers pop-up for entries in Wikipedia
GeoNames data sources: http://www.geonames.org/data-sources.html

Tuesday, May 20, 2014

An Introduction to OpenLayers 3, Part III

This week we will look at adding a Web Map Service (WMS) in OpenLayers 3 (OL3).

Adding a WMS
The code below illustrates how to add a WMS from the National Atlas.  Specifically, I pull from the data section on "people" and the layer named "fd0002_9" which is for Percent of Population that Receives Food Stamps, by County for 2002.  You can view this information on the National Atlas website or load the WMS through QGIS.  For the capabilities file and loading into a GIS, see: http://nationalatlas.gov/infodocs/wms_intro.html.

Key parts of the code are emboldened in red.

   <!--Loads WMS Service from the National Atlas--People: FoodStamps, 2002//-->
   <!--Makes WMS layer transparent, so if can be overlaid on the OSM basemap//-->

 var wmsmap = new ol.layer.Tile({
source: new ol.source.TileWMS({
url: 'http://webservices.nationalatlas.gov/wms?people',
params: {'LAYERS': 'fd0002_9',transparent:'true'},
serverType:'mapserver',
}),
opacity:'0.5'
 });

A basic map is located here: http://webmapexamples.net/WMSExample.html. A text file with the code: http://goo.gl/FGfl1K. However, you won't be able to get any information when you click a county.

Adding Interactivity
In addition, OL3 allows information to be retrieved when a user clicks on a map.  See the more interactive example here: http://webmapexamples.net/WMSExampleFoodStamps.html. Attribute information will be returned in the green box.

Example of a Capabilities File for a WMS from the NationalAtlas.gov.
It contains important information about the map layer/image.
This WMS is queryable (=1) so we can allow users to click an area and return information.  I had to change the INFO FORMAT to text/plain as outlined in the National Atlas's technical documentation.

Lastly, it is important to mention that the NationalAtlas is being merged into the USGS NationalMap later this year.  It is always possible the links for the WMS could change.

Next post: Adding a KML

Helpful OL3 API Docs
http://probins.github.io/ol3docs/apidocs/

Sunday, June 2, 2013

USGS Seamless ArcGIS Toolbar

Paid and free and open-source software (FOSS) and data do not have to work in isolation.  One example is the USGS ArcGIS Toolbar (for versions 9.3 and 10) that allows users to seamlessly download data from the USGS into ArcGIS. 

As stated on the USGS website:
"The purpose of the enhanced tools are to allow the user to define an area of interest (AOI), select products or options for downloading products, and then download the product to a local disk. The capabilities available in ArcMap would allow for more client options: add preview, index and outline layers, template selection, reprojection, and import the downloaded products into the current map overlay. All of this can be done without leaving the ArcMap environment. With the functions included with the ArcGIS toolbox, users may allow for client-side scripting, model-building, and easier integration in local ArcGIS based development." 

It beats hopping from different websites, waiting and moving downloads, checking your e-mail, and all of those other activities preventing you from getting work done!

Check it out here and give it a try!:  http://cumulus.cr.usgs.gov/toolbar.php