Tuesday, August 19, 2014

Free Online Mapping Classes From PSU and Coursera

Course dates: Last updated on 12/16/2014

Penn State has an online Open Web Mapping Class for free using open source software.  The course materials are available at: https://www.e-education.psu.edu/geog585/ through a creative commons license. You can also take the paid version of the online course for credit.  Coursework includes QGIS, GDAL, OGR, GeoServer, TileMill, Openlayers, and OpenStreetMap.  Penn State also has several map-related classes on Coursera.

Coursera has at least six relevant classes to GIS, GPS, and more during this upcoming fall 2014 and winter 2015 sessions.  Please note some of the courses do offer different tracts that range from basic to technical in difficulty.  This fall and winter there are exciting course offerings!

Introductory
One course is on Geodesign
Intermediate-Advanced
Another is on GPS, mapping, and spatial computing
Other-related
Also don't forget, ESRI does have some free and low cost tutorials for ArcGIS on their training page as well: http://www.esri.com/training/main.  Be sure to checkout Directions Magazine's articles and webinars for other opportunities.

If anyone else has any that they would like to share, feel free to write them in the comments section below!

Update #1:  Noteworthy addition:  ESRI is offering a free MOOC or massive open online course entitled "Going Places with Spatial Analysis".  Head over to the link below to signup for notification when registration begins, which is shortly: Going Places Signup / Start Page

Thursday, August 14, 2014

Image Processing Using Orfeo Toolbox in QGIS

Satellite and aerial images are more than pretty pictures.  Each image contains a wealth of data that can be queried, modified, extracted, and visualized through simple and advanced techniques.  This blog entry will cover a few basic tools in the Orfeo Toolbox in QGIS.  Instructions for installing Orfeo Toolbox in the QGIS processing toolbox can be found be clicking here.  There is also a standalone Monteverdi 2 program.

Quick Background on Orfeo Toolbox
The toolbox, often abbreviated OTB, was created to promote the use of several French satellites.  Like many programs, the algorithms are geared towards popular satellites.  For more on its creation, visit: http://www.orfeo-toolbox.org/otb/about-otb.html.

In QGIS
After following the instructions above, go under "Processing" and make sure the "Toolbox" is selected. You will see Orfeo's tools grouped into what types of functions they perform.

Screenshot of Orfeo Toolbox in QGIS's Processing Toolbox
Feature Extraction, Identification, and Classification
Extracting features from imagery is an extremely powerful tool.  For example, roads can be extracted from imagery.  Edges of images and line segments can be detected.  They can a provide a quick unique source of data for areas large and small.  Click on any of the images below to get a closer look.

Extracted edges of buildings at a college campus.

Line segment detection: In this case the lines of a tennis court (and fencing).
The tan lines are generated by the software.
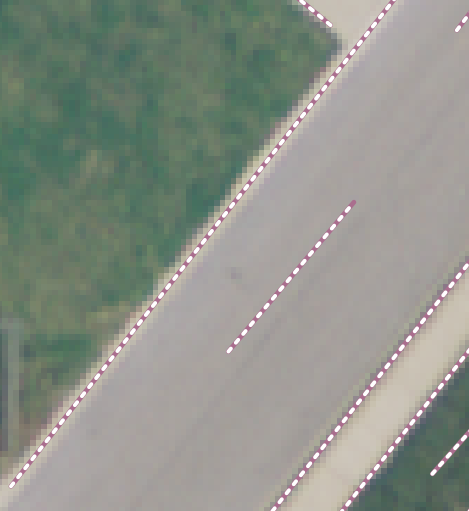
Line segments differentiating a road, sidewalk, and  nearby grass.
Images can also be searched for specific objects. to automate their discovery. Image classification, groupings based on spectral characteristics, whether supervised or unsupervised, is another post in itself.

Change Detection
Another important aspect of imagery is detecting changes over time, whether something is new, absent, modified, or (re)moved.

Left: Unpainted roof, Center: Roof painted red, Right: Change Detection of Roof
Documentation
Remote sensing and image processing are technical fields.  There is a significant amount of documentation (hundreds of pages) on the Orfeo Toolbox website. A shortened manual and a series of short practical exercises could help to expand its user base.  If you work in remote sensing and image processing, be sure to check out this fantastic resource!

Tuesday, August 5, 2014

OpenJUMP for Editing Geometry and Attribute Data

OpenJUMP is a neat little program for editing geometry and attribute data in GIS-related files.  It is free and open source, its project source code can be downloaded.  A full list of its features can be found here. Anyone that has gotten deep into a GIS project knows that inevitably attribute or geometry data will need be edited.  


OpenJUMP can be installed on Windows, Mac OSX, or Linux.  Instructions for installation are found on the project's wiki:  http://ojwiki.soldin.de/index.php?title=Installation#Requirements.

After installing and opening the program, you will find a neat and organized interface.  Setting up workspaces/a project space is easy and smooth, unlike other programs that I have used.  There is a very nice and functional menu bar at the top.  Buttons below provide for basic functions that are common in GIS-related programs.

You will find a lot of functionality in the "Tools", "Rasters"," and Plugins on the top navigation bar.  For example, in Tools you will be able to:
  • Do spatial and attribute queries
  • Proximity/buffer analysis
  • Create statistics about the layer and featurs
  • Generate grids,etc.
  • Perform quality assurance (QA)
  • Edit geometry data
  • Edit attribute data
Also, right-clicking on a loaded layer, will also bring up a wide variety of actions to be performed.

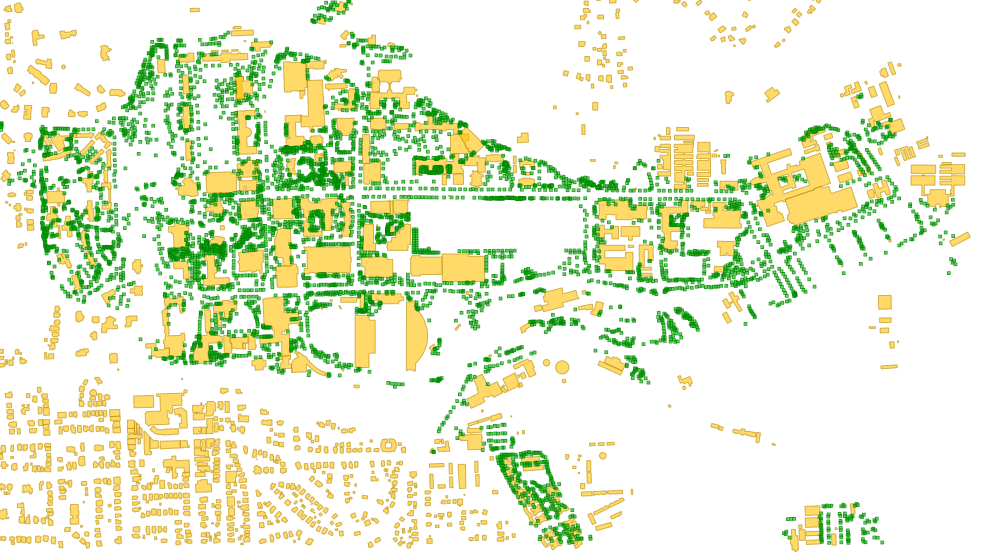
First, our map.  Below is a map of shapefiles loaded in OpenJUMP for Cornell University's campus buildings and a shapefile of trees from an inventory in 2012. Click any of the images below to see them in a larger version.


Cornell University Campus and Tree Inventory.
Editing Attribute Data

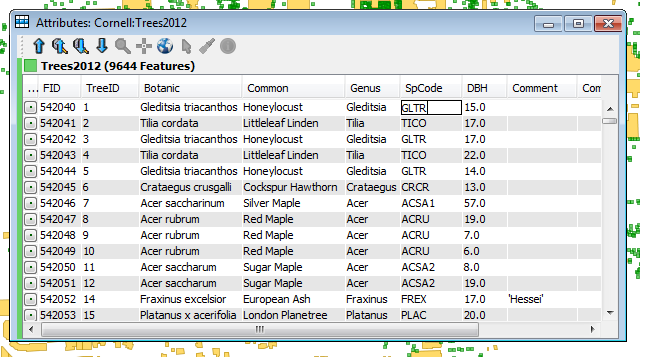
Below is a screenshot of the attribute table in OpenJUMP.  Right-click in the table, and selecting "Editable" allows users to edit attribute data and also brings up an additional Editing Toolbar for editing geometry.

An attribute table for our tree inventory file.
Editing Geometry Data

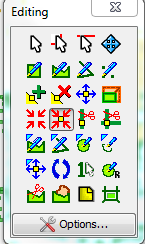
At right: the Editing Geometry toolbar.
Editing geometry toolbar includes the ability to:

  •  Select features, parts, and linestrings
  • Draw rectangle, polygon, linestring, and points
  • Invert, delete, or move a vertex
  • Scale selected items 
  • Snap vertices, snap vertices to selected vertex, split lines, node lines
  • ...and about 12 other actions

So, let's say I wanted to edit a building.  I would right-click on the shapefile and click "Editable" and then make the change, say using the delete vertex tool.  Your cursor becomes a small red x and pulsates/sends a ping to let you know that the action has been completed.

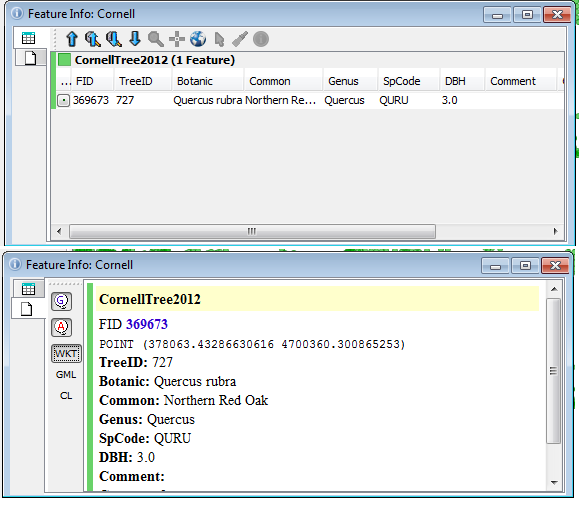
Lastly, a quick word about using the Feature Info Tool / identify tool.  With it, you have several different ways to display information about select features.  The screens below show information for a tree shapefile.

The Feature Info Tool allows you to view attribute and/or geometry data
with a few clicks of a button, it can be viewed in different formats.
OpenJUMP has a lot of interesting features, including exporting images as scaleable vector graphs or *.svg. Be sure to check out OpenJUMP at: http://www.openjump.org/.

Monday, July 28, 2014

Version 2.0 of 3D FugroViewer Released

Version 2.0 of Fugro's free 3D viewer FugroViewer has been released and includes a few improvements. Head over to their website http://www.fugroviewer.com/ to download it.  The release includes support for compressed LIDAR files or *.laz, created by the open source compression program LASzip.  In addition, there are greater export capabilities and the ability to view 3D shapefiles.  A few months ago, I blogged about using the previous version of FugroViewer to examine LIDAR data of the Luxor Hotel in Las Vegas.

After completing a brief form on Fugro's website, you will immediately receive an e-mail with links to download the program and sample data.  The program is small, and sample data sets, which can downloaded individually, range from 30 to 155 MB.

One sample data set is LIDAR data from Baltimore City and includes Baltimore's baseball stadium: Oriole Park at Camden Yards and the Inner Harbor. Reference imagery can be added by going to the "File menu" and selecting "Open Reference File."

Left: LIDAR points overlaying imagery.  Right: 3D view of Camden Yards Stadium

A picture I took at a recent Orioles / O's game.

Another data set is a digital elevation model or DEM from Fugro's GeoSAR/IFSAR/Radar.

A DEM displayed in FugroViewer
Note: Because of its recent release, antivirus programs, such as Norton, may not yet recognize this program and display a warning about a "potential threat."

Thursday, July 10, 2014

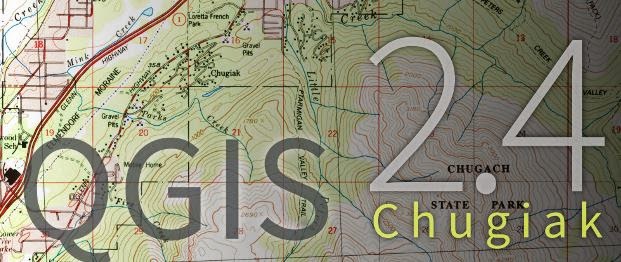
QGIS 2.4 Chugiak Released

The latest version of QGIS, QGIS 2.4 Chugiak, has been released.  Interestingly, the release is named after a location in the United States: Chugiak, Alaska. New features are listed on the change log and include:
  •  Cartography
    • An inverted polygon renderer - allowing everything outside of a polygon to be styled
    • Shapeburst fill style - create a gradient from the polygon line edge to the interior
    • Long lines can be labeled at regular intervals
    • Better print composer - analogous to layout view in ArcGIS
    • Grayscale and colorblindness previews
  • Table attribute data
    • Quick field calculator bar
    • Easier to incorporate tables into maps in print composer
  • Layer style-related
    • Saving and recovering styles from Spatialite layers
    • Added support for QLR files -- analogous to layer file or*.lyr in ArcGIS
    • Shifting marker line placement - allowing the user to specify an offset
  • Metadata-related improvements
    • Applying scale and offset to raster data
    • Generating band names
    • MetaSearch Catalog Client Plugin
  • Performance
    • Multi-threaded rendering - splitting the workload between the cores in your CPU
In the near future, I will post about a few of these improvements and show examples.  Also, if you use QGIS a lot, or just like the idea of a free and open source GIS, then head over to their donation page. I know I did!

Loading screen for QGIS's latest release

Wednesday, July 2, 2014

Summary File 1 DVDs: Quick Access to Detailed Census Data

The U.S. Census Bureau has done a better job of getting data online in consumable formats, most notably adding shapefiles and geodatabases containing demographic, social, and economic data.  Room for improvement remains.  One additional source is a free set of DVDs that contain data at various geographies and levels of detail for variables in Summary File 1.  No Access tables need to be created or linked or statistical code run.
"Summary File 1 (SF 1) contains the data compiled from the questions asked of all people and about every housing unit."
The two DVDs are split into a US Summary and National File (for larger geographies).  Installing both requires 20 GB of free space. A quick overview can be found on the Census website.

Most importantly, the DVDs include a 'data engine' that makes selecting data easier by a variety of criteria including geographic unit, variables of interest, and output format (i.e. *.csv, *.shp, etc.).  There are numerous file types for exporting data.  Summary information can also be displayed in a report format.  The information contained in the DVDs is far more detailed than can be easily found elsewhere.

  • For example, the DVDs contain counts of people for single-year age groups.  
After installing the data engine at data from at least one of the DVDs, you click an icon and get prompted to create a workspace/folder.  You then proceed to pick a geography, output (file type or report), variables, and custom/derived variables that are of interest. A workspace can also be saved for future use.

A screenshot from the Census website showing the data engine
and tabs that you will work through to get your data.
Arrows show how to get started, basic navigation, and the help button.
I have used the DVDs at my work and it is a much more efficient way to navigate through census data, especially if you are near a deadline.  Unfortunately, accessing other census data, such as Summary File 2, remains more challenging.  Be sure to check with your local or state planning agency to see if they have census data posted on their website in shapefiles or spreadsheets for easy use.

Lastly, if you are interested in data from the American Community Survey, be sure to check out the TIGER Products website and the Summary Data Retrieval Tool (direct download link).

Monday, June 16, 2014

Open Topography: A Well-Organized and Feature Rich Site

OpenTopography allows users to register, upload, and download high resolution topography data and tools. as well as download it.  It is run by two universities and funded through a National Science Foundation (NSF) grant.  Below is an overview video of the website.  It is important to note the social features at play and its goals of democratizing information sharing and discovery.


Finding LIDAR data is easy on OpenTopography.  Simply navigate on a map, click a point for more information on the data set, or zoom in for the full coverage area.  In addition, there is a list of tools available and links to them at:  http://opentopo.sdsc.edu/gridsphere/gridsphere?cid=tools.  Click on the screenshots below to take a closer look at using the site.  You can draw a bounding box to select an area of interest.

Finding data is a snap.  Currently, the overwhelming majority of the data is for the continental U.S.
While your data request is being processed, you will receive a nicely formatted report with the associated files and their descriptions. You will also receive an e-mail of the same report with links to your requested files.

Example of a Job Report for data for Washington DC.
Well Organized and Data Ready to Download!
Of course, not only is there free data but but also free tools, like LAStools in QGIS, for looking at your data from OpenTopography.

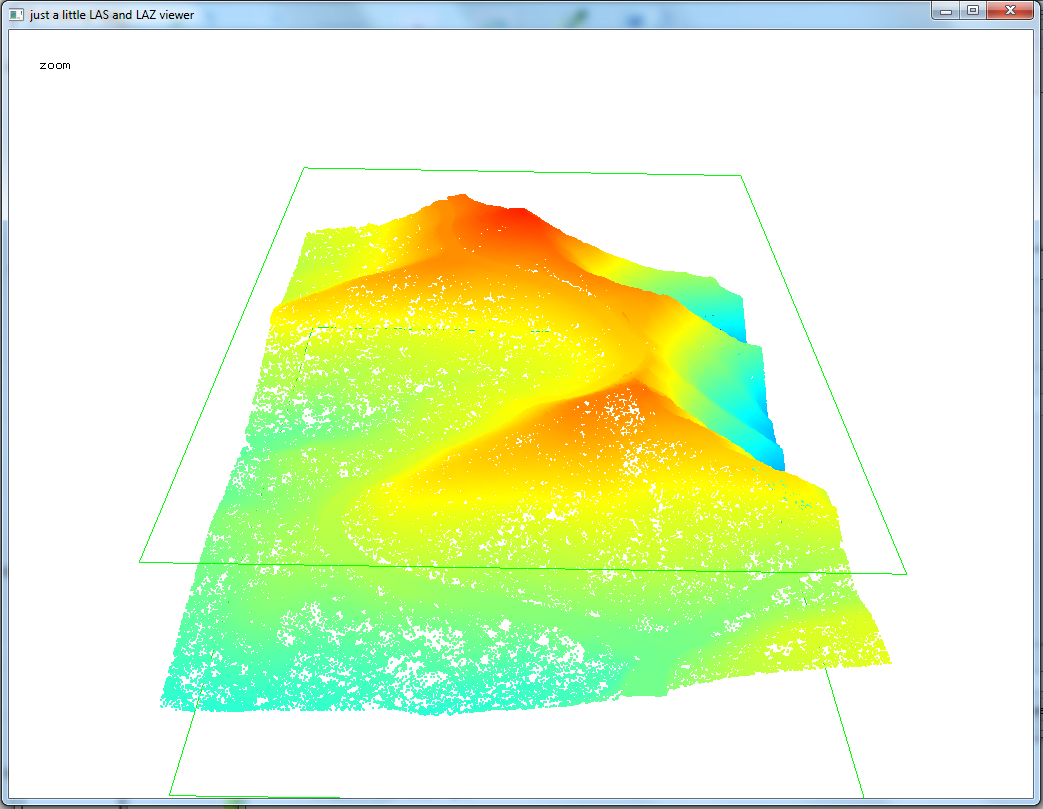
LIDAR data from OpenTopography visualized in LAStools.  Na Pali Coast, Kauai, Hawaii.
Points colored by elevation.  Pressing the space bar allows user to pan, zoom, rotate, etc. with the mouse.