Monday, July 28, 2014

Version 2.0 of 3D FugroViewer Released

Version 2.0 of Fugro's free 3D viewer FugroViewer has been released and includes a few improvements. Head over to their website http://www.fugroviewer.com/ to download it.  The release includes support for compressed LIDAR files or *.laz, created by the open source compression program LASzip.  In addition, there are greater export capabilities and the ability to view 3D shapefiles.  A few months ago, I blogged about using the previous version of FugroViewer to examine LIDAR data of the Luxor Hotel in Las Vegas.

After completing a brief form on Fugro's website, you will immediately receive an e-mail with links to download the program and sample data.  The program is small, and sample data sets, which can downloaded individually, range from 30 to 155 MB.

One sample data set is LIDAR data from Baltimore City and includes Baltimore's baseball stadium: Oriole Park at Camden Yards and the Inner Harbor. Reference imagery can be added by going to the "File menu" and selecting "Open Reference File."

Left: LIDAR points overlaying imagery.  Right: 3D view of Camden Yards Stadium

A picture I took at a recent Orioles / O's game.

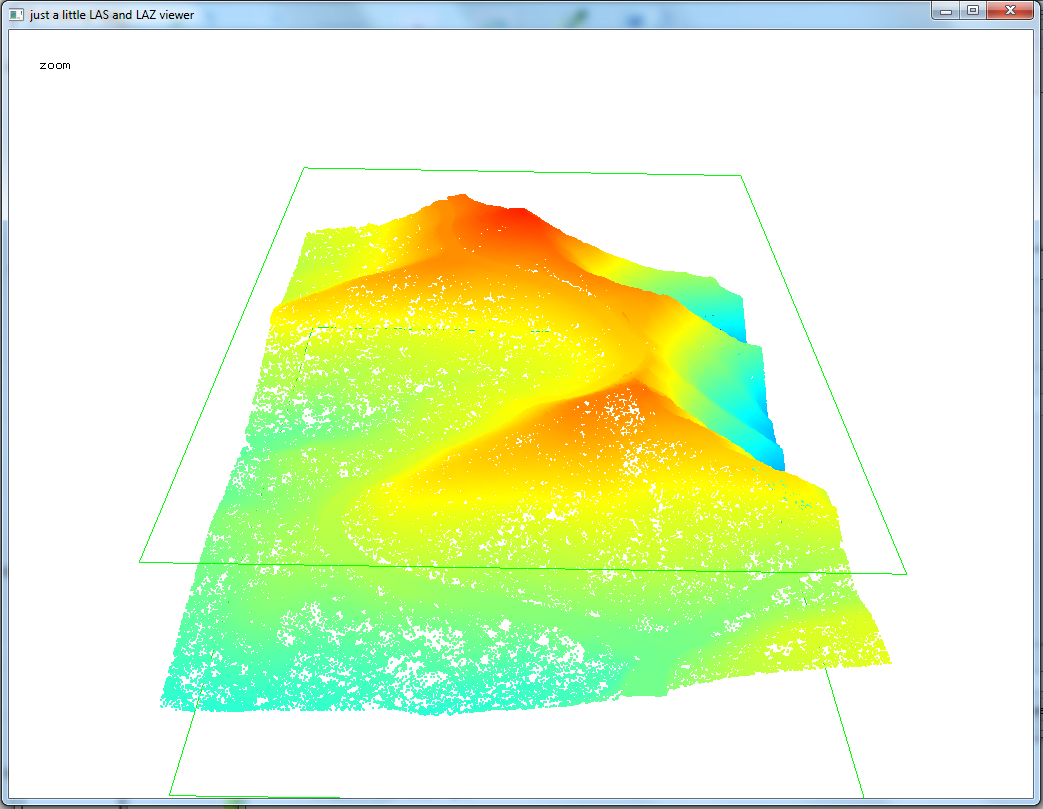
Another data set is a digital elevation model or DEM from Fugro's GeoSAR/IFSAR/Radar.

A DEM displayed in FugroViewer
Note: Because of its recent release, antivirus programs, such as Norton, may not yet recognize this program and display a warning about a "potential threat."

Thursday, July 10, 2014

QGIS 2.4 Chugiak Released

The latest version of QGIS, QGIS 2.4 Chugiak, has been released.  Interestingly, the release is named after a location in the United States: Chugiak, Alaska. New features are listed on the change log and include:
  •  Cartography
    • An inverted polygon renderer - allowing everything outside of a polygon to be styled
    • Shapeburst fill style - create a gradient from the polygon line edge to the interior
    • Long lines can be labeled at regular intervals
    • Better print composer - analogous to layout view in ArcGIS
    • Grayscale and colorblindness previews
  • Table attribute data
    • Quick field calculator bar
    • Easier to incorporate tables into maps in print composer
  • Layer style-related
    • Saving and recovering styles from Spatialite layers
    • Added support for QLR files -- analogous to layer file or*.lyr in ArcGIS
    • Shifting marker line placement - allowing the user to specify an offset
  • Metadata-related improvements
    • Applying scale and offset to raster data
    • Generating band names
    • MetaSearch Catalog Client Plugin
  • Performance
    • Multi-threaded rendering - splitting the workload between the cores in your CPU
In the near future, I will post about a few of these improvements and show examples.  Also, if you use QGIS a lot, or just like the idea of a free and open source GIS, then head over to their donation page. I know I did!

Loading screen for QGIS's latest release

Wednesday, July 2, 2014

Summary File 1 DVDs: Quick Access to Detailed Census Data

The U.S. Census Bureau has done a better job of getting data online in consumable formats, most notably adding shapefiles and geodatabases containing demographic, social, and economic data.  Room for improvement remains.  One additional source is a free set of DVDs that contain data at various geographies and levels of detail for variables in Summary File 1.  No Access tables need to be created or linked or statistical code run.
"Summary File 1 (SF 1) contains the data compiled from the questions asked of all people and about every housing unit."
The two DVDs are split into a US Summary and National File (for larger geographies).  Installing both requires 20 GB of free space. A quick overview can be found on the Census website.

Most importantly, the DVDs include a 'data engine' that makes selecting data easier by a variety of criteria including geographic unit, variables of interest, and output format (i.e. *.csv, *.shp, etc.).  There are numerous file types for exporting data.  Summary information can also be displayed in a report format.  The information contained in the DVDs is far more detailed than can be easily found elsewhere.

  • For example, the DVDs contain counts of people for single-year age groups.  
After installing the data engine at data from at least one of the DVDs, you click an icon and get prompted to create a workspace/folder.  You then proceed to pick a geography, output (file type or report), variables, and custom/derived variables that are of interest. A workspace can also be saved for future use.

A screenshot from the Census website showing the data engine
and tabs that you will work through to get your data.
Arrows show how to get started, basic navigation, and the help button.
I have used the DVDs at my work and it is a much more efficient way to navigate through census data, especially if you are near a deadline.  Unfortunately, accessing other census data, such as Summary File 2, remains more challenging.  Be sure to check with your local or state planning agency to see if they have census data posted on their website in shapefiles or spreadsheets for easy use.

Lastly, if you are interested in data from the American Community Survey, be sure to check out the TIGER Products website and the Summary Data Retrieval Tool (direct download link).

Monday, June 16, 2014

Open Topography: A Well-Organized and Feature Rich Site

OpenTopography allows users to register, upload, and download high resolution topography data and tools. as well as download it.  It is run by two universities and funded through a National Science Foundation (NSF) grant.  Below is an overview video of the website.  It is important to note the social features at play and its goals of democratizing information sharing and discovery.


Finding LIDAR data is easy on OpenTopography.  Simply navigate on a map, click a point for more information on the data set, or zoom in for the full coverage area.  In addition, there is a list of tools available and links to them at:  http://opentopo.sdsc.edu/gridsphere/gridsphere?cid=tools.  Click on the screenshots below to take a closer look at using the site.  You can draw a bounding box to select an area of interest.

Finding data is a snap.  Currently, the overwhelming majority of the data is for the continental U.S.
While your data request is being processed, you will receive a nicely formatted report with the associated files and their descriptions. You will also receive an e-mail of the same report with links to your requested files.

Example of a Job Report for data for Washington DC.
Well Organized and Data Ready to Download!
Of course, not only is there free data but but also free tools, like LAStools in QGIS, for looking at your data from OpenTopography.

LIDAR data from OpenTopography visualized in LAStools.  Na Pali Coast, Kauai, Hawaii.
Points colored by elevation.  Pressing the space bar allows user to pan, zoom, rotate, etc. with the mouse.

Friday, May 30, 2014

GWR4: Software for Geographically Weighted Regression

Today, I will write about a free program that I think remains unknown to many people.  If you are interested in regression models, you will want to keep reading!

GWR4 was developed by the same scholars that created Geographically Weighted Regression (GWR) (Brunsdon, Fortheringham, and Charlton).  In brief, GWR runs local regression models on each geographic feature vs. ordinary least squares (OLS) regression which globally runs one model on all features.  In GWR, coefficient estimates are allowed to vary geographically and can be mapped.
  • Questions that GWR can help answer:
    • General: Do the effects of demographics race, income, education vary geographically on your outcome of interest, after statistical adjustment?
    • Specific:  Does the percent of smokers on prevalence of asthma vary geographically or stay the same? 
      • Since smoking is a major risk factor for asthma, we would expect all local coefficients to be positive--increasing the prevalence or risk of asthma.
GWR4 helps calibrate and run GWR Models. Moreover, it allows for models besides the normal/Gaussian distribution--such as Poisson (for counts and rates) and Logistic (odds).  For people interested in counts and rates, it is vital to be able to use the Poisson distribution.  Currently ArcGIS only uses OLS models.  GWR is a free program but is copyrighted.  It runs on Microsoft Windows.
"GWR 4 can be used to explore geographically varying relationships between dependent/response variables and independent/explanatory variables."
If you are still confused, click the map of Tokyo below--based on GWR4 and the sample data.  Hopefully, this will help clarify the significance of GWR models. (I ran out of time or I would have classified the layer better.  Keep in mind, odds  > 1 each unit increase in the unemployment rate is associated with higher mortality, odds < 1 each unit increase in unemployment rate is associated with lower mortality.)
Odds of the effects of the unemployment rate on mortality among the working age population.  Each of the 262 municipalities in Tokyo has an estimate of unemployment's contribution--adjusted for other variables in the model.
GWR4 has an intuitive user interface, good manual, and sample data with its associated publication. Your sessions/selections  of data, model, specifications, etc. can be saved by going to the file menu.  Be sure to check it out!

Visit here to download GWR4http://www.st-andrews.ac.uk/geoinformatics/gwr/gwr-software/

GWR's Interface and Workflow: Load data->Identify Dependent and Independent Variables-->
--> Choose kernel, bandwidth, and selection criteria-->Output and Execute!

A quick note: I am taking a break from OpenLayers 3 (OL3) to wait for the final code, documentation, tutorials, and books to be completed.  However, we will return to OL3 later this year--when I also hope to have more examples.  Be sure to check out other JavaScript libraries to get maps on the web from Leaflet,  MapBox,  GoogleCartoDB, and any others I missed!  For more information on other similar projects visit the GIS StackExchange

Tuesday, May 20, 2014

An Introduction to OpenLayers 3, Part III

This week we will look at adding a Web Map Service (WMS) in OpenLayers 3 (OL3).

Adding a WMS
The code below illustrates how to add a WMS from the National Atlas.  Specifically, I pull from the data section on "people" and the layer named "fd0002_9" which is for Percent of Population that Receives Food Stamps, by County for 2002.  You can view this information on the National Atlas website or load the WMS through QGIS.  For the capabilities file and loading into a GIS, see: http://nationalatlas.gov/infodocs/wms_intro.html.

Key parts of the code are emboldened in red.

   <!--Loads WMS Service from the National Atlas--People: FoodStamps, 2002//-->
   <!--Makes WMS layer transparent, so if can be overlaid on the OSM basemap//-->

 var wmsmap = new ol.layer.Tile({
source: new ol.source.TileWMS({
url: 'http://webservices.nationalatlas.gov/wms?people',
params: {'LAYERS': 'fd0002_9',transparent:'true'},
serverType:'mapserver',
}),
opacity:'0.5'
 });

A basic map is located here: http://webmapexamples.net/WMSExample.html. A text file with the code: http://goo.gl/FGfl1K. However, you won't be able to get any information when you click a county.

Adding Interactivity
In addition, OL3 allows information to be retrieved when a user clicks on a map.  See the more interactive example here: http://webmapexamples.net/WMSExampleFoodStamps.html. Attribute information will be returned in the green box.

Example of a Capabilities File for a WMS from the NationalAtlas.gov.
It contains important information about the map layer/image.
This WMS is queryable (=1) so we can allow users to click an area and return information.  I had to change the INFO FORMAT to text/plain as outlined in the National Atlas's technical documentation.

Lastly, it is important to mention that the NationalAtlas is being merged into the USGS NationalMap later this year.  It is always possible the links for the WMS could change.

Next post: Adding a KML

Helpful OL3 API Docs
http://probins.github.io/ol3docs/apidocs/

Saturday, May 10, 2014

An Introduction to OpenLayers 3, Part II

Last week, we created a basic web map by loading a basemap from OpenStreetMap using OpenLayers 3 (OL3).  If you missed last week's post, below are links to the code:
This week I will cover copying OL3's JavaScript libraries to a web hosting service. Also, note that you can run basic OpenLayers code off your computer--it simply depends on where the sources of data are located and how the code is written.

In order to get your map visible on the web, you will need a web hosting service or your own server.  After setting up an account, you will have a chance to upload files. Before that, there are a few things you need to know:
  • You will upload folders and files from the OL3 JavaScript library to the public or root directory of your web hosting service.  
  • In some cases, this is simply a matter of placing files in a folder; for some services you may have to set permission levels to public/everyone.
  • An additional step for uploading and accessing layers.
    •  In the next post, we will upload, use, and symbolize this uploaded layer.  
      • OL3 runs client-side (vs the server) so keep that in mind, so you won't want to use this method for large layers.
      • You don't need to do this step or the next one if you are accessing layers using a web map service or WMS.
      • Later I will also look at using GeoServer for more complex layers.
    • In addition, you will have to create a simple web config file to access files on your web hosting service. 
      • This can be done in a text editor, like Notepad. 
      • For example if you plan to use KML files, you will have upload a file with the following code for particular media or MIME types
      • Click to magnify the screenshot below for an example for a *.kml file.
You can find code for other MIME types by searching the web.
Save this code as web.config and upload to the root directory of your web hosting service.
After downloading and unpacking the *.zip file from OL3 (or OL2), you will see several folders and files. 
  • Consider copying all the folders and files over to see examples and understand how the code works
  • Keep in mind how you copy folders and files over, since this will affect how you write code and reference directories.
  • Lastly, the ol.js file you need is in the build folder.  In the first example that I showed (in the code above), you need to change the link to the OL3 website from "http://ol3js.org/en/master/build/ol.js" to "build/ol.js."  The same goes for the css stylesheet.
Next time, we will look at uploading, using, and symbolizing a KML.

For serious developers, be sure to check out the OL3 wiki at: https://github.com/openlayers/ol3/wiki