GeoDa opens as a "floating bar" which you will find nice as you do analysis and realize multiple linked windows can be arranged. The maps and graphs are interactive, as I'll show in later posts, show selecting features in one window will highlight the same parts in other windows.
 |
| When I learn a new piece of software, I always go from left to right. |
File Menu
The "File" menu allows you to import data, save and load projects (self-named *.gda files), and export selected data. In addition, there is a nice Project Information option that tells the title, data source and type, project name, number of observations and fields.
Data Formats
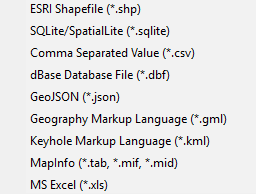
Users can import a wide array of file formats: shapefile, SQLite/SpatialLite, *.csv , .xls, .dbf, .json, .gml, .kml, and MapInfo files. Remember, are analyzing vector data, so points, lines, and polygons. Remember map projections matter, since spatial weights are created based on distance!
 |
| GeoDa does a great job of offering multiple file types to import. |
Tools Menu: Spatial Weights
Spatial weights are used to model spatial relationships. Using GeoDa, we can create spatial weights based on contiguity/bordering (think chess moves: rook or queen), distance, and the number of nearest neighbors. Imagine a grid or matrix that has a row and column for every feature. The cells are populated using 0/1 for weights based on contiguity (where a feature borders another) or distances for distanced based weights.
Tips:
- Generally, do not go above 2nd order of contiguity: 1st order contiguity is neighbors, 2nd order is neighbors of neighbors. Anything beyond this becomes extremely difficult to interpret.
- The GeoDa Center also has PySAL an open source Python library that can be used to create spatial weights and perform spatial analysis.
The first option is "Select" if you have already created weights. The second option is "Create." Here you will a couple of options to examiner spatial relationships in your data. Which one you choose should be based on the phenomenon you are studying. Like other types of analysis, you will also want to examine how different spatial weights affect your results.
Connectivity Histogram
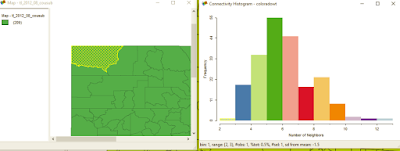
Another one of GeoDa's cool features is a histogram that shows the number of features with a specific number of features. It can also help you clear up any questions you have about different types of contiguity and how spatial relationships are modeled.
 |
On the histogram a right, the bar/bin for two neighbors is selected.
On the map at left the county is highlighted. Selecting other bars would highlight more features.
Users can also see the distribution of the spatial weights from the histogram. |
Shape
In case you tabular data, you can create points from this menu. You can also create a bounding box or grid. Next time, we'll look at the Table and Map toolbars.
Want blog or
YouTube updates? You can follow me @jontheepi:
https://twitter.com/jontheepi


