Showing posts with label attribute data. Show all posts

Monday, November 2, 2015

QGIS 2.12 Release: Focus on Customization

QGIS 2.12 Lyon has been released and focuses on customization based on user preferences and improvements for more efficient workflows.  For a quick overview of changes head over to the Visual Change Log:http://www.qgis.org/en/site/forusers/visualchangelog212/index.html

Project Management
After installing 2.12 and creating or re-saving at least one project, restart QGIS and you will be greeted by a "Recent Projects" window within QGIS that has a thumbnail of your project, title, and a few details, like coordinate system and projection.  Double-click on an entry and you will be taken to your project.

Recent Projects display nicely and neatly within QGIS.

User Interface
You can now change the color scheme of QGIS to suit your liking, daytime, or nighttime mapping lifestyle.  I am sure that the QGIS Community will come up with some neat themes--and at least one in QGIS green!  Note: As of writing, there has been a bug that will be quickly fixed.  How to make changes are described by the feature's creator here: http://nathanw.net/2015/08/29/ui-theme-support-now-core-in-qgis/.  The default UI can be rather bright being both gray and white.  Having some contrast can definitely help users in certain settings.

You can now change the UI theme to suit your liking.
Image source: http://nathanw.net/2015/08/29/ui-theme-support-now-core-in-qgis/

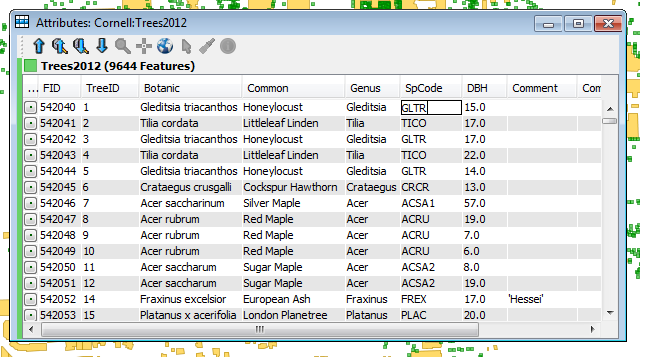
Conditional Formatting in the Attribute Table
Cells in attribute tables can now be color coded based on rules.  This can help to identify certain groups of data as well help to highlight errors or outliers. It is easy to overlook the new button for this feature. After opening the attribute table, look in the upper right-hand corner for a small button with color bars stacked. Click the image below to get a closer look at its placement.
In the table above, records for Alabama ("STATE"='AL') are highlighted in Red,
while Arizona's records below are not highlighted.
The color formats are saved, so when you re-open your QGIS project and the attribute table they will still be there.  It is a good way to keep notes or tag certain records for later.

Labels
There are numerous improvements to labeling including:
  • Only drawing labels that fit inside polygons
  • Label priority and obstacles
  • Rule-based labeling
Print composer
QGIS Atlas in Print Composer is getting closer and closer to ArcGIS's Data Driven Pages that is used to create map books.  Navigation is now easier as buttons allow users to skip ahead to any page in the map book. More data defined controls have been added -- allowing for the creation of more complex map books that loop over different layers.  If you want to learn more about the Atlas feature in QGIS, check out my YouTube video here: https://www.youtube.com/watch?v=gCISvTfHtZc

Symbology
Existing color ramps can now be edited, so you do not have to start from scratch.  This is a definite time-saver and an overdue feature.

All color ramps, including existing ones, can now be edited.

Other Notable New Features
There are improvements to digitizing in QGIS as well as raster alignment tools, and much more!

Thursday, August 28, 2014

An Introduction to Leaflet, Part I: CSVs and Pop-ups

Leaflet is an open source JavaScript library for publishing interactive web-based and mobile maps. Most tutorials on Leaflet's website are geared towards creating basic maps with a small number of features.

Despite this, the code libraries are capable of doing much more!  Today's post will focus on importing and using point data in spreadsheet form, specifically comma separated value files or *.csv.  (In the next post, we will look at other data types and formats.)  l will use the Leaflet Simple CSV Plugin that contains many different features, which I will describe later.

The data
The data set contains locations of homicides (417) in Chicago during 2013.  It also contains attribute data for incident, type, circumstances, arrests, date, and, location.  It is available through Chicago's large open data portal.

End product:
If you want to skip to see the end result, click this link: http://webmapexamples.net/leaflet-simple-csv-master/index.html.  The screenshot below shows the map on an iPad Mini (Gen 1). Click for a closer vew.

On iPad Mini: A Leaflet Map of Homicides in Chicago, 2013
How I got there...
There are several Leaflet plugins to import *.csv files.  On the web, I found the Leaflet Simple CSV Plugin by Matthew Perry that incorporates several different plugins, including a bonus one for clustering/collecting markers, into one set of code. Furthermore, it contains code for allowing attribute data from the *.csv file to be displayed when a marker is clicked.  

Pop-up displaying attribute data from the *.csv about the homicide
The code package put together many different capabilities. It was easy-to-use, modify, has documentation, and a working example.  I accessed the maps on several devices: two different computers, the iPad mini, an iPhone 4S, and a Nexus 7 tablet.  The only device that had an issue was the iPhone 4S.  When clicking a point market, pop-up attribute data was not always displayed and simply flickered.  I am still looking into this and will post anything I found out.

Resources for Learning Leaflet
Leaflet.js Essentials (Published August 2014)

Where to learn JavaScript and more coding skills for free
Codecademy

Tuesday, August 5, 2014

OpenJUMP for Editing Geometry and Attribute Data

OpenJUMP is a neat little program for editing geometry and attribute data in GIS-related files.  It is free and open source, its project source code can be downloaded.  A full list of its features can be found here. Anyone that has gotten deep into a GIS project knows that inevitably attribute or geometry data will need be edited.  


OpenJUMP can be installed on Windows, Mac OSX, or Linux.  Instructions for installation are found on the project's wiki:  http://ojwiki.soldin.de/index.php?title=Installation#Requirements.

After installing and opening the program, you will find a neat and organized interface.  Setting up workspaces/a project space is easy and smooth, unlike other programs that I have used.  There is a very nice and functional menu bar at the top.  Buttons below provide for basic functions that are common in GIS-related programs.

You will find a lot of functionality in the "Tools", "Rasters"," and Plugins on the top navigation bar.  For example, in Tools you will be able to:
  • Do spatial and attribute queries
  • Proximity/buffer analysis
  • Create statistics about the layer and featurs
  • Generate grids,etc.
  • Perform quality assurance (QA)
  • Edit geometry data
  • Edit attribute data
Also, right-clicking on a loaded layer, will also bring up a wide variety of actions to be performed.

First, our map.  Below is a map of shapefiles loaded in OpenJUMP for Cornell University's campus buildings and a shapefile of trees from an inventory in 2012. Click any of the images below to see them in a larger version.


Cornell University Campus and Tree Inventory.
Editing Attribute Data

Below is a screenshot of the attribute table in OpenJUMP.  Right-click in the table, and selecting "Editable" allows users to edit attribute data and also brings up an additional Editing Toolbar for editing geometry.

An attribute table for our tree inventory file.
Editing Geometry Data

At right: the Editing Geometry toolbar.
Editing geometry toolbar includes the ability to:

  •  Select features, parts, and linestrings
  • Draw rectangle, polygon, linestring, and points
  • Invert, delete, or move a vertex
  • Scale selected items 
  • Snap vertices, snap vertices to selected vertex, split lines, node lines
  • ...and about 12 other actions

So, let's say I wanted to edit a building.  I would right-click on the shapefile and click "Editable" and then make the change, say using the delete vertex tool.  Your cursor becomes a small red x and pulsates/sends a ping to let you know that the action has been completed.

Lastly, a quick word about using the Feature Info Tool / identify tool.  With it, you have several different ways to display information about select features.  The screens below show information for a tree shapefile.

The Feature Info Tool allows you to view attribute and/or geometry data
with a few clicks of a button, it can be viewed in different formats.
OpenJUMP has a lot of interesting features, including exporting images as scaleable vector graphs or *.svg. Be sure to check out OpenJUMP at: http://www.openjump.org/.