Showing posts with label kml. Show all posts

Sunday, February 21, 2016

Spatial Analysis with GeoDa: Part II - Importing Data and Tools

GeoDa opens as a "floating bar" which you will find nice as you do analysis and realize multiple linked windows can be arranged.  The maps and graphs are interactive, as I'll show in later posts, show selecting features in one window will highlight the same parts in other windows.

When I learn a new piece of software, I always go from left to right.  
File Menu
The "File" menu allows you to import data, save and load projects (self-named *.gda files), and export selected data. In addition, there is a nice Project Information option that tells the title, data source and type, project name, number of observations and fields.

Data Formats
Users can import a wide array of file formats: shapefile, SQLite/SpatialLite, *.csv , .xls, .dbf, .json, .gml, .kml, and MapInfo files.  Remember, are analyzing vector data, so points, lines, and polygons. Remember map projections matter, since spatial weights are created based on distance!
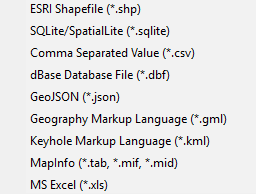
GeoDa does a great job of offering multiple file types to import.
Tools Menu: Spatial Weights
Spatial weights are used to model spatial relationships. Using GeoDa, we can create spatial weights based on contiguity/bordering (think chess moves: rook or queen), distance, and the number of nearest neighbors.  Imagine a grid or matrix that has a row and column for every feature.  The cells are populated using 0/1 for weights based on contiguity (where a feature borders another) or distances for distanced based weights.

Tips:
  • Generally, do not go above 2nd order of contiguity: 1st order contiguity is neighbors, 2nd order is neighbors of neighbors.  Anything beyond this becomes extremely difficult to interpret.
  • The GeoDa Center also has PySAL an open source Python library that can be used to create spatial weights and perform spatial analysis.
The first option is "Select" if you have already created weights.  The second option is "Create."  Here you will a couple of options to examiner spatial relationships in your data.  Which one you choose should be based on the phenomenon you are studying. Like other types of analysis, you will also want to examine how different spatial weights affect your results.
Connectivity Histogram
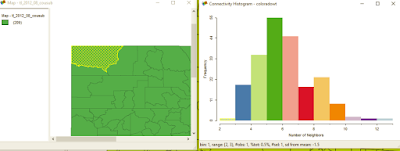
Another one of GeoDa's cool features is a histogram that shows the number of features with a specific number of features.  It can also help you clear up any questions you have about different types of contiguity and how spatial relationships are modeled.

On the histogram a right, the bar/bin for two neighbors is selected.
On the map at left the county is highlighted. Selecting other bars would highlight more features.
Users can also see the distribution of the spatial weights from the histogram.
Shape
In case you tabular data, you can create points from this menu. You can also create a bounding box or grid.  Next time, we'll look at the Table and Map toolbars.

Want blog or YouTube updates?  You can follow me @jontheepi: https://twitter.com/jontheepi
Monday, August 24, 2015

Making Maps with 'Google My Maps', Part II

Now we will look at more features, performance, and wrap up with some strengths and limitations of My Maps.  If you missed the first post, you can check it out here!

Symbology/Icons
Google includes a set of stock symbols that can be added to your map. Clicking on a category in a layer will bring up the option to change the marker color as well as add different icons.  Google has a nice stock selection of icons for: business, crisis, facilities and services, points of interest, recreation, and transportation.
Google has a nice set of stock icons.
You can also add custom icons at the bottom of this pop-up by linking to an image's web address.

Polygons in KML
Adding polygons will slow down your maps performance, currently, when they are clicked the polygon also shows the points that make it up--a strange sight--compared to other web publishing platforms.

Labeling
You can add labels by clicking the style paint brush, but your map will also take a performance hit. However, even with lots of labels, performance remains very respectable.
Adding labels will decrease the performance of your map.

Set Default View/Extent
Click the three vertical dots on the "Add Layer" menu (not the individual layer), and you will see the option to set and confirm and default view/extent, you can zoom in/out and pan and click this to set it.
Setting a good default view can significantly increase your map's appeal.

Limitations
Google has a nice table of file limits at: https://support.google.com/mymaps/answer/3370982?hl=en. Maps are limited to 10 layers, 10,000 features per map (2,000 per layer), maximum of 50 attribute columns, 5 MB for KML/KMZ, and 2,000 rows/points and up to 40 MB for other file types.
Google's clearly lists the limits for data uploads.
Interestingly, maps can be printed in HD up to 4K resolution. The ultra-high definition revolution is upon us!

Conclusion
Google has developed a nice user friendly interface to allow anyone (even non-mappers) to create free interactive maps. Very cool!!  It will be interesting to see how much My Maps is developed/improved, how quickly/slowly, or whether it stays the same.

Monday, August 17, 2015

Making Maps with 'Google My Maps', Part I

Google may be moving away from making software, like Google Earth desktop--the Pro version was made free--but they still have a few tricks up their sleeve.  Recently, Google made a solid entry into the web publishing domain by giving users the tools to create more sophisticated online maps.  Gone are the days of just adding placemarkers, and now users can add spreadsheets (automatically geocoded) and *.kml files.

As of mid-summer, users can now create and manage their own maps via Google Drive, called "Google My Maps" or simply "My Maps."  All you need to do is setup a free Google Drive account, click on "My Drive" at the top, then "New File", and "Google My Maps"

Google created a very user friendly way for users to make online maps from Google Drive.
There are nine different basemaps to choose from.  Adding layers is easy.  Simply, click the link "Import" to add data or "Add Layer" to add additional layers on top or below.  You can add *.csv, *.xlsx, or *.kml files.  You can directly import files by searching your Drive or import them from your desktop.  If you use a spreadsheet, Google will prompt you to identify the location field or field(s) whether an address or placename as well as how to identify/name your features.


In this example, we will look at a spreadsheet of Substance Abuse Clinics (2011) from the City of Chicago of Data Portal.  After clicking "Import, we are asked to select the location field(s). It can handle addresses in a single or multiple fields.  Next, you will be asked what name/title for your places should be.

If Google has problems geocoding a spreadsheet, you will receive a warning.

Next, we will symbolize the markers by "Population Served" or age groups that each clinic serves. You can also change the symbols for each class.

Google allows map creators to make changes to symbology.
At this point, you will probably start to think about saving your project...But, Google has you covered as changes are saved as you go along.  Be sure to give your map a good name, so it does not get lost among your other files.

You can even add a widget for people to get directions.
 Maps can be shared and permissions set with a few clicks after pressing the share button.
What the map looks like so far.  Clicking on markers brings up attribute data.

You can check out the interactive version at: https://goo.gl/39D8lG using your desktop computer or mobile device. Next post, we will look at more features, performance, and wrap up with some strengths and limitations of My Maps. 

Tuesday, February 17, 2015

SaTScan 9.4 released, better than ever!

SaTScan is a program for detecting clusters over space, time, and space-time.  It is available for Windows, Mac OS X, and Linux. SaTScan 9.4 was recently released and it is better than ever!  The data import wizard now allows shapefiles to be read and and a graphing feature has been added to help examine temporal trends. Visit the link for a better look at the rundown of new features.

The Import Wizard now reads shapefiles.
In previous posts, I've covered the types of files you will need and how to aggregate data in preparation for importing it. Since version 9.2, SaTScan has had the ability to export *.kml and *.shp so that the most likely clusters can be viewed in GIS software. (Aside: Google Earth Pro is now free! https://www.google.com/work/mapsearth/products/earthpro.html)

Below is an example looking at clusters of low immunization rates in California from the journal Pediatrics. Free full-text: http://pediatrics.aappublications.org/content/135/2/280.full.pdf+html

In SaTScan, using lat/long coordinates, allows users to export to *.kml and *.shp.
Google Earth opens the *.kml automatically when a run is complete.
A few tutorials are being made, http://www.satscan.org/tutorials.html and sample data is available. Be sure to read the expertly written user's guide before running: http://goo.gl/rHg7M6. and the long and varied bibliography of analyses conducted with SaTScan: http://www.satscan.org/references.html

Update #1 (2/20/15)
Scan statistics can also be implemented in R's Spatial Epi Package and rsatscan.

Wednesday, February 11, 2015

Mapping Data from Google's Global Database for Events, Language, and Tone (GDELT)

The Global Database for Events, Language, and Tone or GDELT Project supported by Google Ideas, monitors global media (in more than 100 languages) and identifies key people, locations, organizations, conflict, and themes. GDELT already has a lot of great features and is moving towards 2.0 with more contextualized geocoding.
"[GDELT's] Event Database archives contain nearly 400 million latitude/longitude geographic coordinates spanning over 12,900 days,...making it one of the largest open-access spatio-temporal datasets in existence." - GDELT website
Event vs. GKG databases
GDELT consists of two databases: 1) an Event and 2) Global Knowledge Graph (GKG) database. The event database is more focused on what and where, while the GKG focuses on 'how something is being said.  With the Event database, you can search by actor (initiator and victim) and by category of exchange / different type of event codes.  With the GKG, you can search by keyword.

One day's worth of events mapped above.  Click the map to enlarge it.
Accessing and downloading data
GDELT data can be accessed in a number of ways for a wide range of users from beginner's to advanced.  You can utilize the Analysis Service, Google Cloud, or raw data--in this case event data. A lot of the data sets are tab delimited.  Column names can be found in the documentation.  Skip to the bottom of this article for more links!

Analysis Service
I have spent most of my time exploring the analysis service that allows you to export raw data, map it, view timelines and a host of other great features. It provides all sorts of tools to access, export, and analyze data including creating heat maps, dynamic KMLs, timelines, network diagrams, graphs  tone graphs, and word clouds!

GDELT's Analysis Service makes the data very accessible.
There is too much to describe, so check it out for yourself by visiting the links below!  Be sure to read through the documentation before getting started!

GDELT Analysis
http://analysis.gdeltproject.org/

Raw Data
http://gdeltproject.org/#downloading
http://data.gdeltproject.org/events/index.html

Documentation and Column Names
http://gdeltproject.org/data.html#documentation
http://data.gdeltproject.org/documentation/GDELT-Data_Format_Codebook.pdf

Conflict Dashboard
http://gdeltproject.org/globaldashboard/

Tuesday, May 20, 2014

An Introduction to OpenLayers 3, Part III

This week we will look at adding a Web Map Service (WMS) in OpenLayers 3 (OL3).

Adding a WMS
The code below illustrates how to add a WMS from the National Atlas.  Specifically, I pull from the data section on "people" and the layer named "fd0002_9" which is for Percent of Population that Receives Food Stamps, by County for 2002.  You can view this information on the National Atlas website or load the WMS through QGIS.  For the capabilities file and loading into a GIS, see: http://nationalatlas.gov/infodocs/wms_intro.html.

Key parts of the code are emboldened in red.

   <!--Loads WMS Service from the National Atlas--People: FoodStamps, 2002//-->
   <!--Makes WMS layer transparent, so if can be overlaid on the OSM basemap//-->

 var wmsmap = new ol.layer.Tile({
source: new ol.source.TileWMS({
url: 'http://webservices.nationalatlas.gov/wms?people',
params: {'LAYERS': 'fd0002_9',transparent:'true'},
serverType:'mapserver',
}),
opacity:'0.5'
 });

A basic map is located here: http://webmapexamples.net/WMSExample.html. A text file with the code: http://goo.gl/FGfl1K. However, you won't be able to get any information when you click a county.

Adding Interactivity
In addition, OL3 allows information to be retrieved when a user clicks on a map.  See the more interactive example here: http://webmapexamples.net/WMSExampleFoodStamps.html. Attribute information will be returned in the green box.

Example of a Capabilities File for a WMS from the NationalAtlas.gov.
It contains important information about the map layer/image.
This WMS is queryable (=1) so we can allow users to click an area and return information.  I had to change the INFO FORMAT to text/plain as outlined in the National Atlas's technical documentation.

Lastly, it is important to mention that the NationalAtlas is being merged into the USGS NationalMap later this year.  It is always possible the links for the WMS could change.

Next post: Adding a KML

Helpful OL3 API Docs
http://probins.github.io/ol3docs/apidocs/

Saturday, May 10, 2014

An Introduction to OpenLayers 3, Part II

Last week, we created a basic web map by loading a basemap from OpenStreetMap using OpenLayers 3 (OL3).  If you missed last week's post, below are links to the code:
This week I will cover copying OL3's JavaScript libraries to a web hosting service. Also, note that you can run basic OpenLayers code off your computer--it simply depends on where the sources of data are located and how the code is written.

In order to get your map visible on the web, you will need a web hosting service or your own server.  After setting up an account, you will have a chance to upload files. Before that, there are a few things you need to know:
  • You will upload folders and files from the OL3 JavaScript library to the public or root directory of your web hosting service.  
  • In some cases, this is simply a matter of placing files in a folder; for some services you may have to set permission levels to public/everyone.
  • An additional step for uploading and accessing layers.
    •  In the next post, we will upload, use, and symbolize this uploaded layer.  
      • OL3 runs client-side (vs the server) so keep that in mind, so you won't want to use this method for large layers.
      • You don't need to do this step or the next one if you are accessing layers using a web map service or WMS.
      • Later I will also look at using GeoServer for more complex layers.
    • In addition, you will have to create a simple web config file to access files on your web hosting service. 
      • This can be done in a text editor, like Notepad. 
      • For example if you plan to use KML files, you will have upload a file with the following code for particular media or MIME types
      • Click to magnify the screenshot below for an example for a *.kml file.
You can find code for other MIME types by searching the web.
Save this code as web.config and upload to the root directory of your web hosting service.
After downloading and unpacking the *.zip file from OL3 (or OL2), you will see several folders and files. 
  • Consider copying all the folders and files over to see examples and understand how the code works
  • Keep in mind how you copy folders and files over, since this will affect how you write code and reference directories.
  • Lastly, the ol.js file you need is in the build folder.  In the first example that I showed (in the code above), you need to change the link to the OL3 website from "http://ol3js.org/en/master/build/ol.js" to "build/ol.js."  The same goes for the css stylesheet.
Next time, we will look at uploading, using, and symbolizing a KML.

For serious developers, be sure to check out the OL3 wiki at: https://github.com/openlayers/ol3/wiki