Showing posts with label scan statistics. Show all posts

Tuesday, February 17, 2015

SaTScan 9.4 released, better than ever!

SaTScan is a program for detecting clusters over space, time, and space-time.  It is available for Windows, Mac OS X, and Linux. SaTScan 9.4 was recently released and it is better than ever!  The data import wizard now allows shapefiles to be read and and a graphing feature has been added to help examine temporal trends. Visit the link for a better look at the rundown of new features.

The Import Wizard now reads shapefiles.
In previous posts, I've covered the types of files you will need and how to aggregate data in preparation for importing it. Since version 9.2, SaTScan has had the ability to export *.kml and *.shp so that the most likely clusters can be viewed in GIS software. (Aside: Google Earth Pro is now free! https://www.google.com/work/mapsearth/products/earthpro.html)

Below is an example looking at clusters of low immunization rates in California from the journal Pediatrics. Free full-text: http://pediatrics.aappublications.org/content/135/2/280.full.pdf+html

In SaTScan, using lat/long coordinates, allows users to export to *.kml and *.shp.
Google Earth opens the *.kml automatically when a run is complete.
A few tutorials are being made, http://www.satscan.org/tutorials.html and sample data is available. Be sure to read the expertly written user's guide before running: http://goo.gl/rHg7M6. and the long and varied bibliography of analyses conducted with SaTScan: http://www.satscan.org/references.html

Update #1 (2/20/15)
Scan statistics can also be implemented in R's Spatial Epi Package and rsatscan.

Monday, January 19, 2015

Using R to Prepare a Case File for SatScan

SaTScan requires several different types of files for analysis: 1)  A case file with a column for the geographic unit. day, month or year (see documentation), and number of cases.  You can aggregate the data into any geographic unit--large or small. 2) A geographic coordinate file (cartesian or lat/long) with the name of the unit (i.e. census tract), x and y for centroids of the geographic units, and 3) population file with the estimated population over the time period-- by year.

In this post, I will describe creating a case file using code in R.  The goal is to create a sum of homicides by month, year (just 2013 for this example), and police beat/post.  We won't worry about any other specifics (i.e. degree) or related types of crimes, i.e. shootings.

To ready yourself for data preparation, read Richard Block's tutorial or the more extensive SatScan manual.

I use crime data from Chicago's Open Data Portal.  The same code can be applied to other types of data, health data, etc.  A few key points: 1) the data contains victim-based data--which we want to convert into incidents. 2) not every post has a homicide, and 3) the reference post list contains 275 post.  So, we will end up with a data set with 3300 rows (275 x 12 months) or simply a row for each post-month.

If you want to skip ahead and just look at the code, go to: http://goo.gl/pmOi1u.


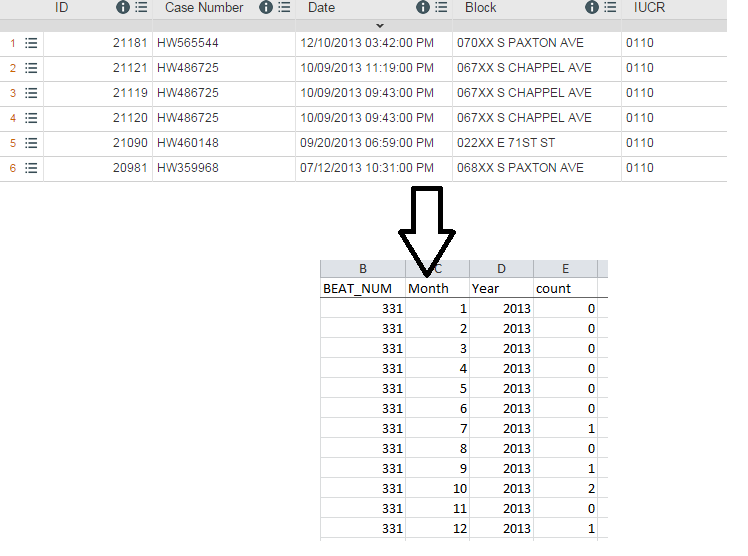
At the top: What you start with.  Bottom: After processing in R

Overview of Steps: See the code for further details

Step #1: Two files are imported: 1) a victim-based file of all crimes, which is narrowed down to just homicides (you could also add in shootings) and 2) a 'reference' file or simply a list of the police beats/posts in Chicago.

Step #2:  The data are summed up so that each row contains the total number of victims, then grouped again into incidents by using two different count variables.

Step #3: The list of police beats get column variables for each month in the year and expanded by reshaping data from wide to long.  This serves as a 'reference list' for matching purposes.

Step #4:  The two data sets are matched the 'unmatched' records are also kept.  These are post-months that don't have a homicide, so each count value is replaced with a zero.

Step #5: To ensure the code has worked, I check the total number of rows (3300) and spot check various posts to make sure the data has been grouped in to incidents and posts correctly.  

Whether in R or using for-fee software (i.e. SAS, STATA), preparing data for SaTScan is relatively straightforward but there are a number of steps.

Update #1 (2/18/15)
Scan statistics can also be implemented in R's Spatial Epi Package and rsatscan .

Wednesday, January 7, 2015

FGBASE: Fast Grid-Based Spatial Data Mining

FGBASE is a new open source software for using scan statistics on gridded data.  Unlike SaTScan, FGBASE only currently runs on Mac OS X (10.6, 10.7, and 10.8) instead of Windows and also allows for its source code to be downloaded here: http://www.fgbase.org/download-fgbase/.  The software was specifically created for environmental epidemiology but has potential applications to any fields of study concerned with finding clusters.

Analyzing aggregate data, using either software package, helps to speed up computationally intensive equations for finding spatial, temporal, or spatiotemporal clusters.

Comparison of FGBASE and SaTScan


FGBASE
SaTScan
Operating system(s)
Mac OS X
Windows, Linux,
Mac OS X
Open source code
Yes
No
Geographic output
In app
New: Export to KML or SHP
Sample data sets
Yes, 1
Yes, several
Documentation
TBD
Extensive
Publications
1
Extensive, hundreds
           
Although FGBASE comes with some sample data (available at: http://www.fgbase.org/user-data/), the program was only recently released.  Aside: The data set is different from the one used in the published paper, so you will notice differences when looking at your screen.  What data sets you will need and how they are structured is available at: http://www.fgbase.org/user-data/.

Clusters can be examined using a data-driven approach answering the question: where are the clusters?  Or, a hypothesis-driven approach can be used: are there clusters relative to a source(s) of exposure, where entities (factories,etc.) may be responsible for the clustering of cases.

A stock screenshot of FGBASE. Source: IJHG
I downloaded and installed FGBASE.  I will check back in with more impressions in a few months. Adding documentation, with a tutorial, or even a short YouTube video could greatly aid users.  I also plan to blog about getting data into SatScan and interpreting results later in the year.  Since FGBASE's source code is public, hopefully this will speed further development of the program and aid troubleshooting.

Read more at the International Journal of Health Geographics:
http://www.ij-healthgeographics.com/content/pdf/1476-072X-13-46.pdf

See also:
Treescan
R: Spatial Epi Package
There is also an experimental SaTSViz plugin in QGIS but I have not had a chance to look at.

Sunday, May 5, 2013

Space-Time Cluster Analysis with SatScan

For more information: Visit the latest post on SatScan: http://opensourcegisblog.blogspot.com/2015/02/satscan-94-released-better-than-ever.html

Original post
Numerous basic and advanced techniques exist for finding spatial and temporal clusters.  Searching for clusters has broad applications for any field of scientific inquiry!

Unlike other spatial models in other free and paid software, SatScan's statistics' probability distributions allow for poisson (count data and rates) and binomial distributions--to name two.  There is also the ability to treat same data as continuous.  You won't find an easier way to do this than with SatScan!

SatScan is a free program but requires several steps to get data into it for analysis.  For most analyses you will need three files in a text delimited format -- without column headers (such as variable names).

The three files: 1)  A case file with a column for the geographic unit. day, month or year (see documentation), and number of cases.  You can aggregate the data into any geographic unit--large or small. 2) A geographic coordinate file (cartesian or lat/long) with the name of the unit (i.e. census tract), x and y for centroids of the geographic units, and 3) population file with the estimated population over the time period-- by year.

After this slightly painful process, which one learned, can easily be duplicated, one can easily perform complex spatial analysis and adjust key parameters such as the population at risk and maximum size of the cluster.  Time units are important, and you will have to make key decisions as to how long a cluster may have to develop--depending on the problem of interest.

SatScan can look for purely spatial, purely temporal, space-time, and spatial variation in temporal trends in data.   SatScan uses 'scan' statistics/scanning window and cylinder to finding and differentiating potential clusters.

SatScan's output includes *.txt and/or *.dbf files of the results and clusters.  The *.gis file can be joined to the shapefile of the geographic units, which are using, to show risks and different clusters.  This part is straightforward and less painful.  You will need to take your time selecting parameters and interepreting results!

Two good articles to read are: 1)  Block's Tutorial and Review   and 2) Visual Analytics of Space-Time Statistics.  The SatScan manual on its website also has a great list of references.

Additional Article:
http://medicine.plosjournals.org/archive/1549-1676/2/3/pdf/10.1371_journal.pmed.0020059-L.pdf