Showing posts with label image processing. Show all posts

Thursday, September 3, 2015

Tips for Using LIDAR and LAStools in QGIS

LIDAR is an important technology that is undergoing continuous and expansive growth and predicted to reach $1 billion by 2020.  A recent report also describes ongoing developments in LIDAR in Europe. NOAA has a great one-hour Introduction to LIDAR that I recommend checking out: http://coast.noaa.gov/digitalcoast/training/intro-lidar

Source: Allied Market Research, https://www.alliedmarketresearch.com/lidar-market
LAStools is the popular LIDAR processing tool created by the developer of *.las and compressed *.laz formats.  There is a standalone program as well as toolboxes for a variety of programs including QGIS. We will cover a few tips and wrap up with a look at Wizard Island, Crater Lake, Oregon.

Linking LAStools with QGIS
Linking the two has gotten much simpler since QGIS 2.4.  Simply download the *.zip file from: http://lastools.org/download/lastools.zip.  Unzip the file, and copy and past the LAStools folder into a simple directory like "c:/" If you have QGIS running, close it before proceeding.

Tip #1: Users often copy the folder to a folder pathway that is complex and includes spaces like c:/Program Files/ or c:/My Documents. It will not work. Again, use simple path names, no spaces!

Tip #2: This also applies for any files you import with LAStools or export during processing in QGIS.

After doing this, start QGIS, go to the Processing Toolbar, click "Tools for LiDAR Data"->Activate-> and enter or browse to the folder pathway. I've been using LAStools with the most recent version of QGIS (2.10) and have not had any problems yet.

Linking LAStools and QGIS has gotten much easier!
Click "Ok", then head over to the Processing Toolbox side-panel, and you will see the tools ready-to-use!

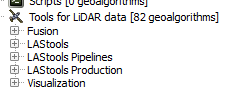
Expand and see a wide range of tools at your disposal!
Note: The LAStools Production or PRO tools are for batch processing.

Tip #3: If you run a tool and nothing happens, be sure that NONE of the folder pathways, for importing data and exporting results, are complex and/or contain spaces.

Tip #4: Be sure to read the "Log" for important information and troubleshooting.


Tip #5:  When using lasview in QGIS, pressing Space bar changes your ability to navigate from zoom, tilt,pan, and translate.  In the upper-left of the window, you will see the navigation type change as you press it.

Furthermore, right-clicking the mouse, brings up a menu for changing the view of LIDAR, from selecting returns, how to symbolize/color data.

The right click menu in LAStools

Tip #6: To get a 3D view, press Space bar until Pan is displayed, if is not already.  Click and hold your mouse, then move it up to the top of the screen and voila!


Wizard Island, Crater Lake, Oregon, Data from: Open Topography. lasnoise was also used.
See also:
OpenTopography
Digital Coast
3D Elevation Program
Google search for "County lidar" and State LIDAR

Saturday, August 1, 2015

Tutorial: Side-by-Side Maps in QGIS Print Composer

Step #1: Open New Print Composer
QGIS print composer can be a bit daunting and confusing. It is equivalent to the Layout View in ArcGIS, where users can setup their map for printing and publication. One common task is to create side-by-side maps, to compare imagery, choropleth, or other types of maps.  I looked but could not find a good tutorial with screenshots, so here we go!


Purpose
To create three side-by-side maps of different band combinations from Landsat 7 imagery of the Salton Sea. The maps will be exactly the same size.  The different band combinations were created using the Orfeo Toolbox->Image Manipulation->Images Concatenation and selecting various band combinations.

Step #1:  For starters...
I've started by just selecting the natural color view (bands 3-2-1).  Go to the the Project Toolbar in the upper left-> New Print Composer. 

  • You can also can the page layout to landscape or portrait, depending on whether your map series will be laid out horizontally or vertically.

Step #2:  Creating the first map

Click the "Add New Map" button, highlighted in red. and draw an area for your map on the blank page.  For best fit of your image, be sure in QGIS to have zoomed into an area of interest. 


  • Then on the right hand side of print composer, select "Item Properties" and click the long button for "Set to Map Canvas."
After Steps #1-2

Step #3: Add the second map

Before adding the second map to the right, scroll up in "Item properties" and check the box for "Lock layers for map item."  The click on the existing map in print composer and copy and paste it. On this second map, be sure to uncheck the box we just checked: Uncheck "Lock layers for map item."


  • In QGIS, add the next layer, in this case I added a false color image from bands 4-3-2.
  • Go back into Print Composer and hit the blue refresh button.
  • The second map should display the false color image and the first map should remain natural color.
After Step #3

Step #4: Repeat for the third map
Before copying and pasting, make sure to check the "Lock layers for map item" box.  Copy, paste, and then uncheck this for the third map, with the last set of band combinations (7-4-2).  The final map appears below.
Click to enlarge the map.
Three side-by-side maps, equal sized, and the same scale.
For more information:
You can find additional tips about using the map composer from multiple frames and different layers in this discussion on StackExchange: http://gis.stackexchange.com/questions/45174/how-to-handle-multiple-map-frames-with-different-layers-in-one-print-layout

Thursday, August 14, 2014

Image Processing Using Orfeo Toolbox in QGIS

Satellite and aerial images are more than pretty pictures.  Each image contains a wealth of data that can be queried, modified, extracted, and visualized through simple and advanced techniques.  This blog entry will cover a few basic tools in the Orfeo Toolbox in QGIS.  Instructions for installing Orfeo Toolbox in the QGIS processing toolbox can be found be clicking here.  There is also a standalone Monteverdi 2 program.

Quick Background on Orfeo Toolbox
The toolbox, often abbreviated OTB, was created to promote the use of several French satellites.  Like many programs, the algorithms are geared towards popular satellites.  For more on its creation, visit: http://www.orfeo-toolbox.org/otb/about-otb.html.

In QGIS
After following the instructions above, go under "Processing" and make sure the "Toolbox" is selected. You will see Orfeo's tools grouped into what types of functions they perform.

Screenshot of Orfeo Toolbox in QGIS's Processing Toolbox
Feature Extraction, Identification, and Classification
Extracting features from imagery is an extremely powerful tool.  For example, roads can be extracted from imagery.  Edges of images and line segments can be detected.  They can a provide a quick unique source of data for areas large and small.  Click on any of the images below to get a closer look.

Extracted edges of buildings at a college campus.

Line segment detection: In this case the lines of a tennis court (and fencing).
The tan lines are generated by the software.
Line segments differentiating a road, sidewalk, and  nearby grass.
Images can also be searched for specific objects. to automate their discovery. Image classification, groupings based on spectral characteristics, whether supervised or unsupervised, is another post in itself.

Change Detection
Another important aspect of imagery is detecting changes over time, whether something is new, absent, modified, or (re)moved.

Left: Unpainted roof, Center: Roof painted red, Right: Change Detection of Roof
Documentation
Remote sensing and image processing are technical fields.  There is a significant amount of documentation (hundreds of pages) on the Orfeo Toolbox website. A shortened manual and a series of short practical exercises could help to expand its user base.  If you work in remote sensing and image processing, be sure to check out this fantastic resource!