Wednesday, September 23, 2015

Video: Free and Open Source GIS Reference Data

After last week's post looking at the landscape of free and open source GIS software, the next logical step is looking at open GIS data. This video looks at reference data. I am still deciding on what to do the next video on...the choices are a) Open data portals, b) novel data types, social media (TwitteR and Instagram), or c) remote sensing.  Let me know what you would like to see in the comments below.


Topics covered in the video include:
Census: https://www.census.gov/geo/maps-data/data/tiger.html
DataFerrett: http://dataferrett.census.gov/
Summary File 1 DVD: https://www.census.gov/mp/www/cat/decennial_census_2010/summary_file_1_1.html
Natural Earth: http://www.naturalearthdata.com/
OpenStreetMap: https://www.openstreetmap.org/
GeoNames: http://www.geonames.org/
US Board on Geographic Names:http://geonames.usgs.gov/domestic/index.html
Maryland Department of Planning/ACS: http://www.mdp.state.md.us/msdc/S7_ACS.shtml

Tuesday, September 15, 2015

Video: A Quick Introduction to Free and Open Source GIS

My first video has been posted to YouTube.  It briefly covers the landscape of free and open source GIS (FOSS GIS), remote sensing and processing, a few related tools, and JavaScript libraries for creating online interactive webmaps.  It does not cover every program out there but gives new and returning users a place to see all of the options available.  You can check it out here: https://www.youtube.com/watch?v=rB_qnTE-W9c or subscribe to the channel by clicking here.

I hope to bring out more videos in the near future including delving into each of the programs and step-by-step tutorials.  So stay tuned!  As always feel free to leave comments, questions, or feedback below.  Be sure to like the video and subscribe if you would like to see more.

Thursday, September 3, 2015

Tips for Using LIDAR and LAStools in QGIS

LIDAR is an important technology that is undergoing continuous and expansive growth and predicted to reach $1 billion by 2020.  A recent report also describes ongoing developments in LIDAR in Europe. NOAA has a great one-hour Introduction to LIDAR that I recommend checking out: http://coast.noaa.gov/digitalcoast/training/intro-lidar

Source: Allied Market Research, https://www.alliedmarketresearch.com/lidar-market
LAStools is the popular LIDAR processing tool created by the developer of *.las and compressed *.laz formats.  There is a standalone program as well as toolboxes for a variety of programs including QGIS. We will cover a few tips and wrap up with a look at Wizard Island, Crater Lake, Oregon.

Linking LAStools with QGIS
Linking the two has gotten much simpler since QGIS 2.4.  Simply download the *.zip file from: http://lastools.org/download/lastools.zip.  Unzip the file, and copy and past the LAStools folder into a simple directory like "c:/" If you have QGIS running, close it before proceeding.

Tip #1: Users often copy the folder to a folder pathway that is complex and includes spaces like c:/Program Files/ or c:/My Documents. It will not work. Again, use simple path names, no spaces!

Tip #2: This also applies for any files you import with LAStools or export during processing in QGIS.

After doing this, start QGIS, go to the Processing Toolbar, click "Tools for LiDAR Data"->Activate-> and enter or browse to the folder pathway. I've been using LAStools with the most recent version of QGIS (2.10) and have not had any problems yet.

Linking LAStools and QGIS has gotten much easier!
Click "Ok", then head over to the Processing Toolbox side-panel, and you will see the tools ready-to-use!

Expand and see a wide range of tools at your disposal!
Note: The LAStools Production or PRO tools are for batch processing.

Tip #3: If you run a tool and nothing happens, be sure that NONE of the folder pathways, for importing data and exporting results, are complex and/or contain spaces.

Tip #4: Be sure to read the "Log" for important information and troubleshooting.


Tip #5:  When using lasview in QGIS, pressing Space bar changes your ability to navigate from zoom, tilt,pan, and translate.  In the upper-left of the window, you will see the navigation type change as you press it.

Furthermore, right-clicking the mouse, brings up a menu for changing the view of LIDAR, from selecting returns, how to symbolize/color data.

The right click menu in LAStools

Tip #6: To get a 3D view, press Space bar until Pan is displayed, if is not already.  Click and hold your mouse, then move it up to the top of the screen and voila!


Wizard Island, Crater Lake, Oregon, Data from: Open Topography. lasnoise was also used.
See also:
OpenTopography
Digital Coast
3D Elevation Program
Google search for "County lidar" and State LIDAR

Monday, August 24, 2015

Making Maps with 'Google My Maps', Part II

Now we will look at more features, performance, and wrap up with some strengths and limitations of My Maps.  If you missed the first post, you can check it out here!

Symbology/Icons
Google includes a set of stock symbols that can be added to your map. Clicking on a category in a layer will bring up the option to change the marker color as well as add different icons.  Google has a nice stock selection of icons for: business, crisis, facilities and services, points of interest, recreation, and transportation.
Google has a nice set of stock icons.
You can also add custom icons at the bottom of this pop-up by linking to an image's web address.

Polygons in KML
Adding polygons will slow down your maps performance, currently, when they are clicked the polygon also shows the points that make it up--a strange sight--compared to other web publishing platforms.

Labeling
You can add labels by clicking the style paint brush, but your map will also take a performance hit. However, even with lots of labels, performance remains very respectable.
Adding labels will decrease the performance of your map.

Set Default View/Extent
Click the three vertical dots on the "Add Layer" menu (not the individual layer), and you will see the option to set and confirm and default view/extent, you can zoom in/out and pan and click this to set it.
Setting a good default view can significantly increase your map's appeal.

Limitations
Google has a nice table of file limits at: https://support.google.com/mymaps/answer/3370982?hl=en. Maps are limited to 10 layers, 10,000 features per map (2,000 per layer), maximum of 50 attribute columns, 5 MB for KML/KMZ, and 2,000 rows/points and up to 40 MB for other file types.
Google's clearly lists the limits for data uploads.
Interestingly, maps can be printed in HD up to 4K resolution. The ultra-high definition revolution is upon us!

Conclusion
Google has developed a nice user friendly interface to allow anyone (even non-mappers) to create free interactive maps. Very cool!!  It will be interesting to see how much My Maps is developed/improved, how quickly/slowly, or whether it stays the same.

Monday, August 17, 2015

Making Maps with 'Google My Maps', Part I

Google may be moving away from making software, like Google Earth desktop--the Pro version was made free--but they still have a few tricks up their sleeve.  Recently, Google made a solid entry into the web publishing domain by giving users the tools to create more sophisticated online maps.  Gone are the days of just adding placemarkers, and now users can add spreadsheets (automatically geocoded) and *.kml files.

As of mid-summer, users can now create and manage their own maps via Google Drive, called "Google My Maps" or simply "My Maps."  All you need to do is setup a free Google Drive account, click on "My Drive" at the top, then "New File", and "Google My Maps"

Google created a very user friendly way for users to make online maps from Google Drive.
There are nine different basemaps to choose from.  Adding layers is easy.  Simply, click the link "Import" to add data or "Add Layer" to add additional layers on top or below.  You can add *.csv, *.xlsx, or *.kml files.  You can directly import files by searching your Drive or import them from your desktop.  If you use a spreadsheet, Google will prompt you to identify the location field or field(s) whether an address or placename as well as how to identify/name your features.


In this example, we will look at a spreadsheet of Substance Abuse Clinics (2011) from the City of Chicago of Data Portal.  After clicking "Import, we are asked to select the location field(s). It can handle addresses in a single or multiple fields.  Next, you will be asked what name/title for your places should be.

If Google has problems geocoding a spreadsheet, you will receive a warning.

Next, we will symbolize the markers by "Population Served" or age groups that each clinic serves. You can also change the symbols for each class.

Google allows map creators to make changes to symbology.
At this point, you will probably start to think about saving your project...But, Google has you covered as changes are saved as you go along.  Be sure to give your map a good name, so it does not get lost among your other files.

You can even add a widget for people to get directions.
 Maps can be shared and permissions set with a few clicks after pressing the share button.
What the map looks like so far.  Clicking on markers brings up attribute data.

You can check out the interactive version at: https://goo.gl/39D8lG using your desktop computer or mobile device. Next post, we will look at more features, performance, and wrap up with some strengths and limitations of My Maps. 

Saturday, August 1, 2015

Tutorial: Side-by-Side Maps in QGIS Print Composer

Step #1: Open New Print Composer
QGIS print composer can be a bit daunting and confusing. It is equivalent to the Layout View in ArcGIS, where users can setup their map for printing and publication. One common task is to create side-by-side maps, to compare imagery, choropleth, or other types of maps.  I looked but could not find a good tutorial with screenshots, so here we go!


Purpose
To create three side-by-side maps of different band combinations from Landsat 7 imagery of the Salton Sea. The maps will be exactly the same size.  The different band combinations were created using the Orfeo Toolbox->Image Manipulation->Images Concatenation and selecting various band combinations.

Step #1:  For starters...
I've started by just selecting the natural color view (bands 3-2-1).  Go to the the Project Toolbar in the upper left-> New Print Composer. 

  • You can also can the page layout to landscape or portrait, depending on whether your map series will be laid out horizontally or vertically.

Step #2:  Creating the first map

Click the "Add New Map" button, highlighted in red. and draw an area for your map on the blank page.  For best fit of your image, be sure in QGIS to have zoomed into an area of interest. 


  • Then on the right hand side of print composer, select "Item Properties" and click the long button for "Set to Map Canvas."
After Steps #1-2

Step #3: Add the second map

Before adding the second map to the right, scroll up in "Item properties" and check the box for "Lock layers for map item."  The click on the existing map in print composer and copy and paste it. On this second map, be sure to uncheck the box we just checked: Uncheck "Lock layers for map item."


  • In QGIS, add the next layer, in this case I added a false color image from bands 4-3-2.
  • Go back into Print Composer and hit the blue refresh button.
  • The second map should display the false color image and the first map should remain natural color.
After Step #3

Step #4: Repeat for the third map
Before copying and pasting, make sure to check the "Lock layers for map item" box.  Copy, paste, and then uncheck this for the third map, with the last set of band combinations (7-4-2).  The final map appears below.
Click to enlarge the map.
Three side-by-side maps, equal sized, and the same scale.
For more information:
You can find additional tips about using the map composer from multiple frames and different layers in this discussion on StackExchange: http://gis.stackexchange.com/questions/45174/how-to-handle-multiple-map-frames-with-different-layers-in-one-print-layout

Wednesday, July 8, 2015

What to Expect in QGIS 2.10 Pisa

With the next release of QGIS on the horizon, I downloaded the latest nightly build and looked through the visual change log to see what to expect.  What I found is very exciting!

If you have not looked at QGIS Visual Change Log, it is a quick way to see changes from release-to-release.  It includes screenshots and quick explanations of the upcoming changes.  It also lists the contributor(s) and funding source.

Rasters
The new release includes log functions (natural and base 10) for the raster calculator.  This is great since many remote sensing calculations use logs, for example land surface temperature via Landsat 8. Zonal Statistics for rasters is now included as a core plugin of QGIS.  This allows users to summarize the characteristics of raster layers using a polygon layer for setting zones.

Symbology and Histograms
When you go to symbolize a layer using a graduated scheme, you can now adjust the breaks by using an interactive histogram, akin to what you will find in ArcGIS.  If you change your classification scheme, be sure to (re)load or reclassify the layer before clicking on the histogram tab.  Below is quick example using population by county for Maryland.

Histogram view of two classification schemes:
Top: Equal interval, Bottom: Quantile / Equal Count
Live layer effects
Live layer effects is probably the most talked about new feature and was crowd-sourced.  It adds the ability for a variety of effects including a drop shadow.  The creator of this feature has a 
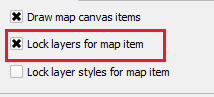
great post and quick how-to. Basically, when you got to style a layer, look towards the bottom, check the "Draw Effects" check-box.  Then, look a fair way to your right and click the 'yellow star.'

I found using this to be much easier-to-use than its implementation in ArcGIS.

It can be easy to overlook the Draw Effects check box when styling.
Adding effects is easy-to-do in QGIS and look good!
Often, I feel my maps can get stale, or someone wants a more 'graphic' or photo-shopped look for a presentation, other product, or to develop a 'brand.' So having this feature is great, especially, if like me, you are not an expert graphic designer or cartographer. I look forward to seeing creative uses of this feature in the QGIS Flickr Map Showcase.  There may already be a few in there!

Follow point labeling
Good, clear, and legible labeling help separate the good mappers from the bad.  Follow point labeling has been added to align text based on where the label is located.  So, if a label appears to the left of a point, the text will be right-aligned.  This will also help with multi-line labels.

True Curves
There is a new geometry engine which allows for 'true curves' to be represented as such -- instead of segmented lines or polygons.  If I am not mistaken, I believe this is very important for a variety of users, but particularly for CAD users or those that use CAD and GIS.

New desktop icon
To start QGIS, the old familiar neon yellow/green "Q" is gone in favor of a more professional looking two-tone green globe for an icon.  I am glad that the distinctive QGIS green remains,  For those using both ArcGIS and QGIS installed on the same computer, it will still be easy to distinguish between the program icons.