CAST is a nifty piece of software that combines key functions of other programs from the ASU GeoDA Center with a greater emphasis on temporal trends. It even allows you to view data by calendar days, months, and years.
What you will need...
All you need is a shapefile of projected crime incident data and any boundary files (posts, census tracts, blocks, etc.). To perform some types of cluster analysis, you will also need to aggregate your data. If all you have is a *.csv, you can use QGIS to crate a shapefile file and save it for importing into CAST. There is sample data from San Francisco available here.
Check the format of your date field
If you are having trouble with using your data's date fields in CAST, use QGIS's field calculator to create a new variable with an output field type of "Date." Next, use "Conversions" and "to date" under the function list, and make sure the variable you enter is in the format "YYYY-MM-DD". So, the expression should read: todate( "Date Field" )
- Make sure to create separate fields for date and time--rather than one single field.
- I tried a couple different formats but this format worked.
- In CAST, you will be able to select your date field.
In the "Tools" menu, you can create a grid and save it as a shapefile. Under "Table", you can view attribute data for your shapefile. The "Weights" menu allows you to create spatial weights and view a connectivity histogram, like in GeoDA. The "Map" menu allows you to symbolize polygons by several different criteria. The real fun comes in the last four menus: Calendar Map, Cluster Map, Time, and Explore.
Calendar Map + Dynamic Map
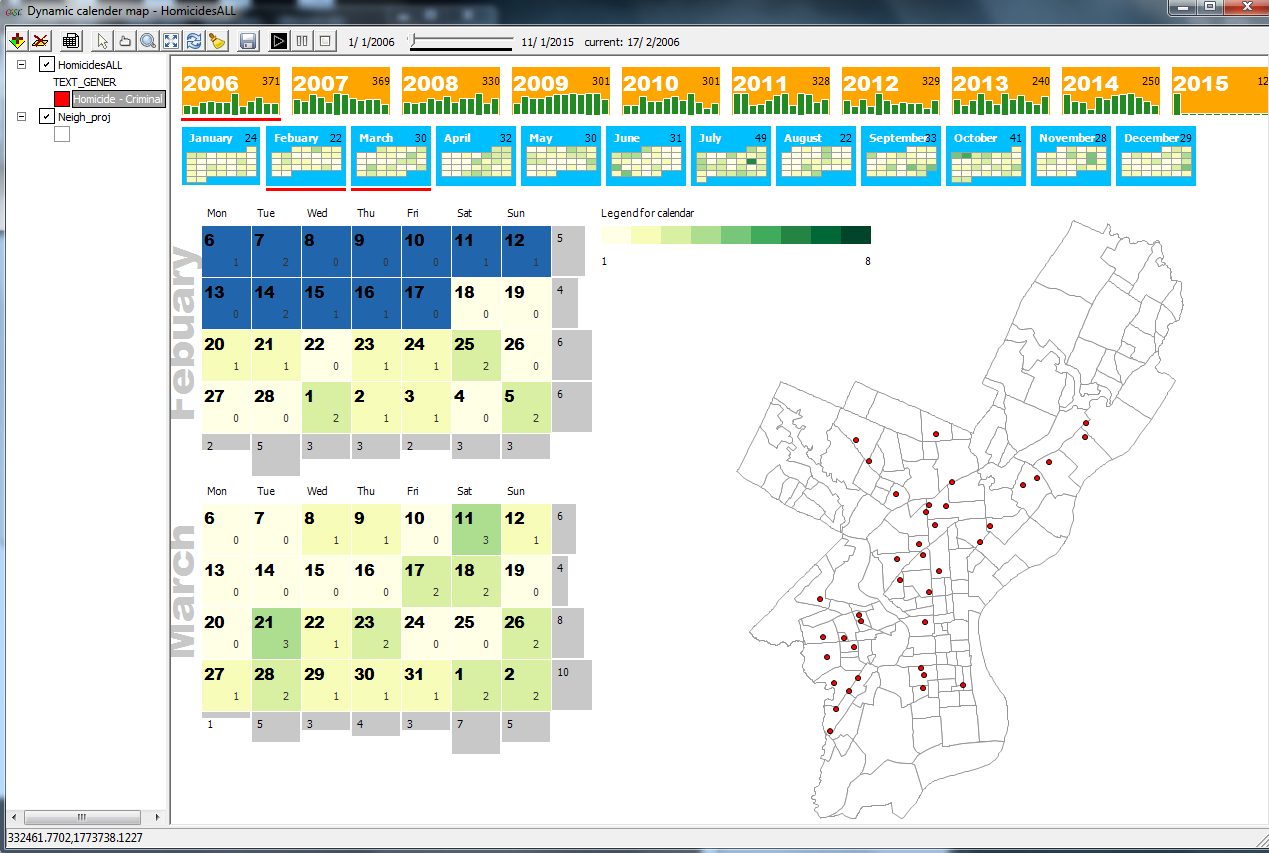
One of CAST's interesting features is combing a calendar with the number of events and a map. You can add shapefiles and layer them, although a bit tricky by clicking on each. Below are few examples using homicide data from Open Data Philly.
 |
| A calendar and map of homicides in Philadelphia starting in 2006. |
 |
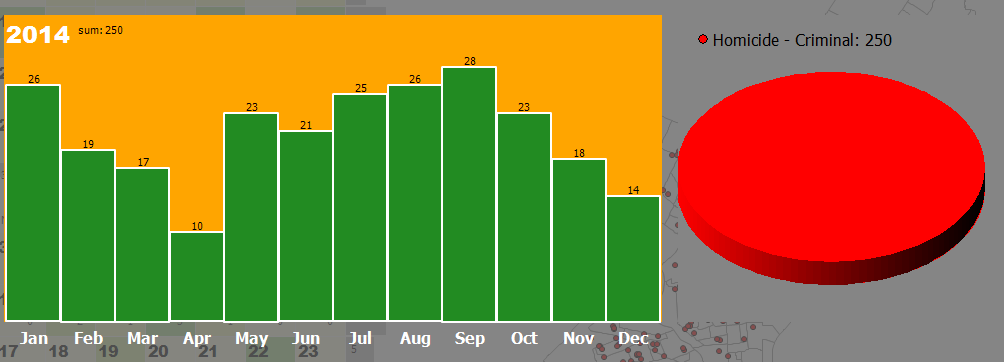
| Clicking a calendar will bring up a bar and pie graph (which can show a breakdown if there is more than one category of crime/event in your data). |
 |
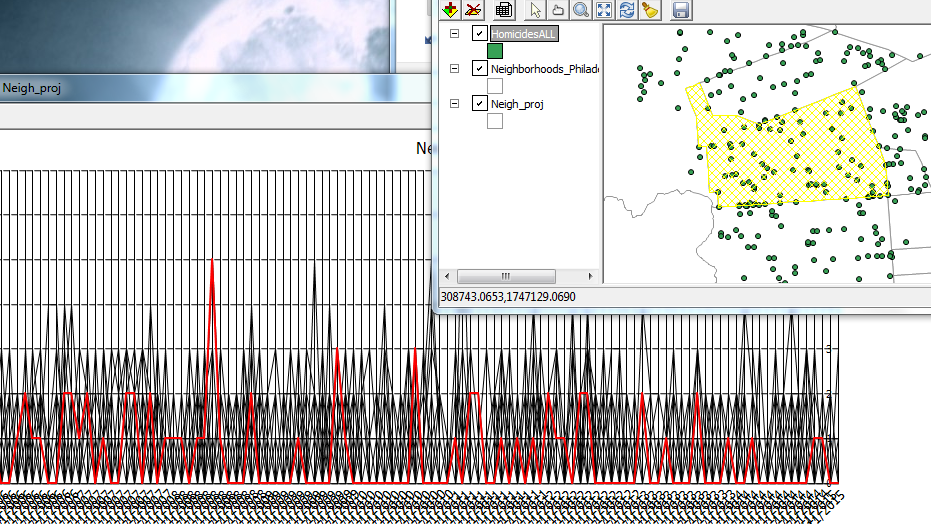
| Like other ASU software, all graphs and maps are linked. Here one line was selected, which represents one neighborhood, and the corresponding area on the map is highlighted. |
You will find a lot of tasks that are identical to GeoDA here plus some dynamic density maps.
Time & Explore
Trend graphs area available here as well as standard graphs like a histogram, scatterplot, and boxplots.
In sum...
Looking at patterns over space and time is difficult, but CAST can help. Unfortunately, you cannot save a session in CAST so be sure to keep track of what steps you perform. Limit your data to the time period of interest. I would not recommend adding huge point shapefiles. Lastly, I was not able to save a movie/*.gif of animations over time, but if I figure it out, I will update this post.
For more information:
CAST Manual
Thanks, this is generally helpful.
ReplyDeleteStill, I followed step-by-step your method in this
dot net training
dot net course
Nice & Informative Blog !
ReplyDeleteOur team at QuickBooks Phone Number makes sure to assist you with the best-in-class services during this confusing time.
Nice Blog !
ReplyDeleteWhile working on QuickBooks software, you may face QuickBooks Error 1304.We provide immediate assistance to our customers so that you can resume your work as soon as possible.
Nice blog. Thanks for sharing with everyone. If you are trying to resolve a QuickBooks Error and Need customer support, click here: QuickBooks phone number
ReplyDeleteWe hope the above-mentioned factors have helped you know why QuickBooks Error 1304 takes place. For further information, give us a call on our Toll-Free Number (855)-948-3651.
ReplyDeleteVery Informative Article Thanks For sharing Such as Information If you have query and want to know more information regarding quickbooks then call at Quickbooks Phone Number (855) 377-7767
ReplyDelete