Thursday, January 21, 2016

Looking at Weather Maps and Data for Winter Storm Jonas

Previously, I've written about Being Weather Ready: The Open Source Way and Weather GIS, Data, and Viewers. I would probably stop blogging about the weather if there weren't bigger storms each year. Family, friends, and coworkers often ask me what the weather will be like or get confused about updated/changing predictions.  Maybe yours do to!
NOAA has recently quadrupled their computing power which will lead to better forecasts for everything from winter storms to major hurricanes.
Fortunately, there is a lot of great information, maps, and data out there, if you know where to look! Winter storms don't carry official names. But,the Weather Channel has adopted this idea and named the upcoming storm "Jonas."

Local Forecast Office
The National Weather Service (NWS) has local forecast offices spread throughout the country. Often, the offices have specific pages to deal with certain weather threats.

For example, the Sterling Office for DC-Virginia-Maryland has a Winter Weather Page: http://www.weather.gov/lwx/winter. The maps below show the:
  • At the top, links and headlines highlight key weather threats and message
  • Minimum, most likely, and maximum amount of snowfall
  • Storm track, time of onset, and reported snowfalls are all clearly labeled. 
  • Warning areas are highlighted at a county level. Clicking the map takes you to the local forecast in text--with additional links to hourly graphs.
  • Probabilities are given for different snowfall amounts
  • Weather fronts are highlighted nationally
  • Lastly, always check the time stamp of the forecast map, since forecasts change frequently.
I'm from Baltimore, so the expected snowfall is between 23-25 inches, Range 7 to 27 inches.  The storm is expected to start between 3 to 5 pm. See weather forecasting is not that hard! (just kidding).  Be sure to read any text warnings and messages. Surface winds will be the 30 mph range with gusts possibly exceeding 50 mph. For more on effects of wind speed, check out: http://www.weather.gov/media/iwx/webpages/skywarn/Beaufort_Wind_Chart.pdf 
The NWS packs a lot of information neatly into their web page.
Although a 'long' web page, there is a clear hierarchy of information from
most important to least important and specific weather information to
general climate information.
Some weather information can't be captured well on maps, so you will also have to look at graphs.

NWS also has a GIS Data Portal (http://www.nws.noaa.gov/gis/) so you can make your own maps. But you don't have to go through all those steps and can use web-based map tools like NOWCOAST (http://nowcoast.noaa.gov/) for real-time information and the easier to use Enhanced Data Display (http://preview.weather.gov/edd/). There is also a briefing site: http://www.weather.gov/briefing/

Storm Results
See below from the NWS, or check out the NY Times map "How much snow has fallen?"http://www.nytimes.com/interactive/2016/01/22/us/east-coast-snow-storm.html?_r=0
Jonas shaped up to be everything the predictions were!

Satellite Imagery

A Snow Blanket for the East Coast.  NASA Earth Observatory images (first, second)
 by Joshua Stevens, using Landsat data from the 
U.S. Geological Survey.
 NASA image (third) by Jeff Schmaltz, 
LANCE/EOSDIS Rapid Response.
Caption by Mike Carlowicz.

Map Examples
Some maps convey their message better than others.  Weather maps are no exception...What do you think about the maps below? You be the judge...

Easiest on the Eyes
USA Today had the most pleasing storm map that I could find. Simple and effective.

  • At this scale, the classification and increment of snowfall is appropriate. Although not described in the text, the mapmaker assumes the reader will see that Washington and Charleston, highlighted differently in white, will receive the most snowfall.

Source: USA Today
Hard on the Eyes
The Weather Channel loves translucent boxes, apparently.  This map of regional temperatures and precipitation probably combines too much information on one map. 

  • Precipitation type is also classified into different colors and different icons (snowflakes and rain drops). 

The second places cities and accumulation totals in boxes which makes it harder to read.  The boxes for cities probably is not necessary.
Source: Weather Channel via AccuWeather

Too Slow...but...
Lastly, it is notable to add that ESRI deploys personnel for large disasters, and usually posts a quick map.  Although in this case, their snow map animation is nothing to get excited about: http://www.esri.com/services/disaster-response/severe-weather/us-snowfall-forecast.

  • However, one nice feature, which I wish I saw more of in other interactive maps, are spatial bookmarks that allow the viewer to jump to certain places in the map.

Slow animation but spatial bookmarks (drop-down at the top) are a nice touch and speed navigation.

Monday, January 4, 2016

Video: Open GIS Data Portals

Open GIS data portals are becoming more common, and can contain lots of geospatial data, but is it a case of too much of a good thing?


What is a Portal?
An internet site providing access or links to other sites. In the case of open GIS data, the file may appear on the same page, link out to another website (or portal) or require more digging.  In addition, some GIS portals have links to web map services.

Search is the thing...
Open data portals house more and more data and therefore can become more difficult to search over time. Creating complex searches is sometimes not available and can slow the discovery process.

What are they made of?
Open data portals leverage free and open, propriety, or hybrid data and/or GIS platforms.

Here one minute, gone the next...
While often data can be downloaded directly, some sites link to external or partner data sources. Some data may seem accessible and near-at-hand but actually require more searching and digging.

Syndication
In some cases, this is the result of syndicated data sets. For example, on federal data portals, local and state governments can have their data sets metadata appear in search results and link out to the resource.  In others, this can be overused, frustrating, or lead to broken links or missing resources. Sometimes going directly to the source can be easier than navigating a much larger data portal.

Examples
We will look at several open data portals for geospatial data:
Also check out http://dataportals.org/ for a neat interactive map of open data portals worldwide.

Looking for an open data portal?  Check out the interactive and searchable map on dataportals.org

Tuesday, December 8, 2015

QGIS and FOSS GIS Wishlist for 2016

Happy holidays! I am certainly thankful for QGIS this year as it showed significant improvements to its capabilities and the user experience.  Many other free and open source GIS projects also improved including a major update of GRASS GIS and gvSIG graduating from incubation. In addition, SaTScan continues to get easier to use while providing advanced spatio-temporal statistics. GeoDA has reached nearly 150,000 downloads, and LAStools continues to rock!

Thanks to QGIS and  ALL FOSS GIS Developers!
I wanted to take a moment to talk about my QGIS wishlist for 2016.  In the coming year, I hope to get more involved...I am aiming for trying to create some plugins. You can checkout the QGIS roadmap and submit requests for new features at: http://hub.qgis.org/projects/quantum-gis/roadmap.

What are your wishes for QGIS in 2016?  Feel free to leave them in comment section below!

Of course, the core QGIS developers are always hard at work, and some of these may not be scheduled for the near or future release, but it is always good to dream! These are on the advanced feature end, and although not critical, would be nice to have.

My QGIS wishlist for 2016:
  • Continued commitment to cartography (definitely happening)
  • Full-funding goals reached for crowdsourced QGIS plugins and projects.
  • More maps in the QGIS Flickr Showcase (Do your part!)
  • Continued improvements to the Print Composer
  • Error-free or near-error free releases of QGIS. 
    • I worry as more features are added, more bugs could creep in!
  • Ability to join points to lines - visualizing data by street segments can be extremely cool!
  • More spatial analysis tools integrated directly into QGIS core
    • Might include linear directional mean, standard distance, or others...
  • Ability to create an address locator from reference data
    • Online locators have limitations (number of records that can be (batch) geocoded) and can't be used for confidential data
Some other/non-QGIS wishes
How to contribute
Lastly, there are many ways to contribute to QGIS: http://qgis.org/en/site/getinvolved/index.html. Also, if you use QGIS, whether for school, business, government, or non-profit, please consider a donation!  https://www.qgis.org/en/site/getinvolved/donations.html

Monday, November 2, 2015

QGIS 2.12 Release: Focus on Customization

QGIS 2.12 Lyon has been released and focuses on customization based on user preferences and improvements for more efficient workflows.  For a quick overview of changes head over to the Visual Change Log:http://www.qgis.org/en/site/forusers/visualchangelog212/index.html

Project Management
After installing 2.12 and creating or re-saving at least one project, restart QGIS and you will be greeted by a "Recent Projects" window within QGIS that has a thumbnail of your project, title, and a few details, like coordinate system and projection.  Double-click on an entry and you will be taken to your project.

Recent Projects display nicely and neatly within QGIS.

User Interface
You can now change the color scheme of QGIS to suit your liking, daytime, or nighttime mapping lifestyle.  I am sure that the QGIS Community will come up with some neat themes--and at least one in QGIS green!  Note: As of writing, there has been a bug that will be quickly fixed.  How to make changes are described by the feature's creator here: http://nathanw.net/2015/08/29/ui-theme-support-now-core-in-qgis/.  The default UI can be rather bright being both gray and white.  Having some contrast can definitely help users in certain settings.

You can now change the UI theme to suit your liking.
Image source: http://nathanw.net/2015/08/29/ui-theme-support-now-core-in-qgis/

Conditional Formatting in the Attribute Table
Cells in attribute tables can now be color coded based on rules.  This can help to identify certain groups of data as well help to highlight errors or outliers. It is easy to overlook the new button for this feature. After opening the attribute table, look in the upper right-hand corner for a small button with color bars stacked. Click the image below to get a closer look at its placement.
In the table above, records for Alabama ("STATE"='AL') are highlighted in Red,
while Arizona's records below are not highlighted.
The color formats are saved, so when you re-open your QGIS project and the attribute table they will still be there.  It is a good way to keep notes or tag certain records for later.

Labels
There are numerous improvements to labeling including:
  • Only drawing labels that fit inside polygons
  • Label priority and obstacles
  • Rule-based labeling
Print composer
QGIS Atlas in Print Composer is getting closer and closer to ArcGIS's Data Driven Pages that is used to create map books.  Navigation is now easier as buttons allow users to skip ahead to any page in the map book. More data defined controls have been added -- allowing for the creation of more complex map books that loop over different layers.  If you want to learn more about the Atlas feature in QGIS, check out my YouTube video here: https://www.youtube.com/watch?v=gCISvTfHtZc

Symbology
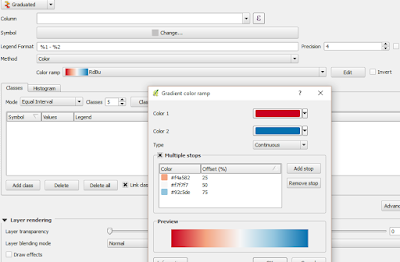
Existing color ramps can now be edited, so you do not have to start from scratch.  This is a definite time-saver and an overdue feature.

All color ramps, including existing ones, can now be edited.

Other Notable New Features
There are improvements to digitizing in QGIS as well as raster alignment tools, and much more!

Thursday, October 22, 2015

Book Review: An Introduction to R for Spatial Analysis and Mapping

I decided to talk a walk on the wild-side and examined R as a GIS for spatial analysis.  I hope to use several of R's spatial statistics packages and to automate tasks--staying within one program.  I highly recommend Brunsdon and Comber's book ($50 on Amazon, Paperback, electronic versions also available).

About the Authors: Chris Brunsdon is the creator of geographically weighted regression or GWR. Lex Comber is a professor at Leeds University.

Four Reasons to choose R as a GIS
1)  You are interested in performing tailored exploratory spatial data analysis (ESDA), spatial statistics, regression analysis, and diagnostics.
  • Of course, R is also way better than ArcGIS and QGIS for summary statistics too. (Notably, QGIS has integrated a R processing toolbox into it. ArcGIS  also has an official bridge to R.)
2)  You already use R for non-spatial data, have lots of code written, and need to analyze spatial data.

3)  You do not want to export your data (or results) from one program into another and back again!

4) You want to be able to publish or share your code with a wider audience.

A great cover to a great book!
Reader Accessibility
The content is extremely well-presented, clear and concise, and includes color graphics. It is not overly technical. Still, R as a GIS and spatial analysis are tough material and is definitely not for the faint-of-heart. The authors assume readers may not have either a R or GIS background, or both. I took a R class in graduate school and occasionally use it.

Additional packages that assist in manipulating and reshaping data, such as plyr, are also discussed. The authors also warn readers that R packages can change over time, causing error messages, but many warn users about recent and upcoming changes.

Overview
In the first 40 pages, you will learn R basics, if you don't already have a foundation. Next, you will learn GIS fundamentals, how to plot data to create a map, taking into account scale, and adding and positioning common map elements like a north arrow and scale bar. This may sound basic but in R nothing is easy!  Of course, the advantage with code is that you can reuse it or may only need to modify it slightly for many maps.

Late in Chapter 5-6 the book dives into spatial analysis.  The last few chapters are probably the best of the book, as more advanced statistical techniques are discussed including local indicators of spatial auto correlation (LISAs), geographically weighted summary statistics and regression.

The book providers a great guide and reference, and I am sure I will be re-visiting it frequently!  Overall, it is a great mix of practice and theory.

Disclosures: 
None, I found and purchased the book on my own.

Wednesday, October 14, 2015

Video: QGIS Print Composer - Side-by-Side Maps and Atlas

QGIS has a powerful print composer that allows users to create complex maps very quickly.  Two common practical examples include creating: 1) side-by-side (or multiple maps) on the same canvas/layout and 2) a map book or atlas. This week's video looks at these cases: https://www.youtube.com/watch?v=gCISvTfHtZc.


In the video, we will create side-by-side maps of different band combinations of remote sensing imagery of the Salton Sea.  For a related blog post, visit:
http://opensourcegisblog.blogspot.com/2015/08/tutorial-side-by-side-maps-in-qgis.html

We will also use the atlas to take a closer look a battleground states during the 2012 presidential election.

Lastly, I searched high and low, but I could not find any guidance or cartographic reference on creating side-by-side maps. So, I looked through several dozen examples, found a couple of themes, and drafted some suggestions --which you can find towards the introduction--and below.
A few suggestions for creating multiple maps on the same canvas/layout.
In the coming months, we will also re-visit the atlas function in print composer and look at more complex examples.

Sunday, October 4, 2015

Video: Tips for Using QGIS Print Composer

QGIS Print Composer can be a little awkward to use at first.  It is analogous to Layout View in ArcGIS.  We will look at some tips to make it easier to use and understand how to create maps in QGIS.


In the video, we will review a map of 2012 Presidential Election Results, as seen below.


In Part II, I will show you how to create side-by-side map series, which is great to look at changes over time as well as different band combinations in remote sensing.  We will also take a look at creating an atlas or map book, essentially iterating/repeating the map making process by a geographic area.  Lastly, we will take a look at the QGIS Map Showcase on Flickr.

If there is something you would like to see, let me know in the comments section below.

Update #1: Print composer has an add Legend button but in this video I used an image file because I used some fancy rule-based symbology, the legend was not easy to look at. Normally, I would just select add Legend.