Friday, October 17, 2014

Customizing Qgis2threejs Code

I have received a few e-mails about customizing the output from the cool Qgis2threejs plugin, created by Minoru Akagi.  The QGIS plugin allows for the creation of a 3D map that can be placed in a website or run off your computer's web browser, without having to install any additional software.

The plugin has been improved and enhanced since my original post on Manhattan and follow-up post.  The best part is that the code is well annotated and easy to follow, so you do not need to be a coding expert to make some neat and fun changes!

In this post, I open up a few of the different file types, edit a few values, and show the results.  I will also briefly talk about some of the plugins newer options, including labels!  What mapper does not love to be able to add labels...and labels for 3D!  Neat stuff!!

Saving the Plugin's Output
At the bottom of the plugin, you will see a white box that allows you to browse to a location to store the output.  Selecting a location, several files will be output instead of being stored in a temporary folder.

Results are easy to export to a folder destination of your choosing.

Starting view: Before changing the code

Starting view from the plugin (before any changes to code)
HTML File:  Camera and Controls

First, I will edit the starting position of the camera.  The three values for the camera.position.set are X,Y, and Z values.

Original:
 var camera = new THREE.PerspectiveCamera(45, width / height, 0.1, 1000);
  camera.position.set(0, -100, 100);

Changed to:
 var camera = new THREE.PerspectiveCamera(45, width / height, 0.1, 1000);
  camera.position.set(0, 0, 75);

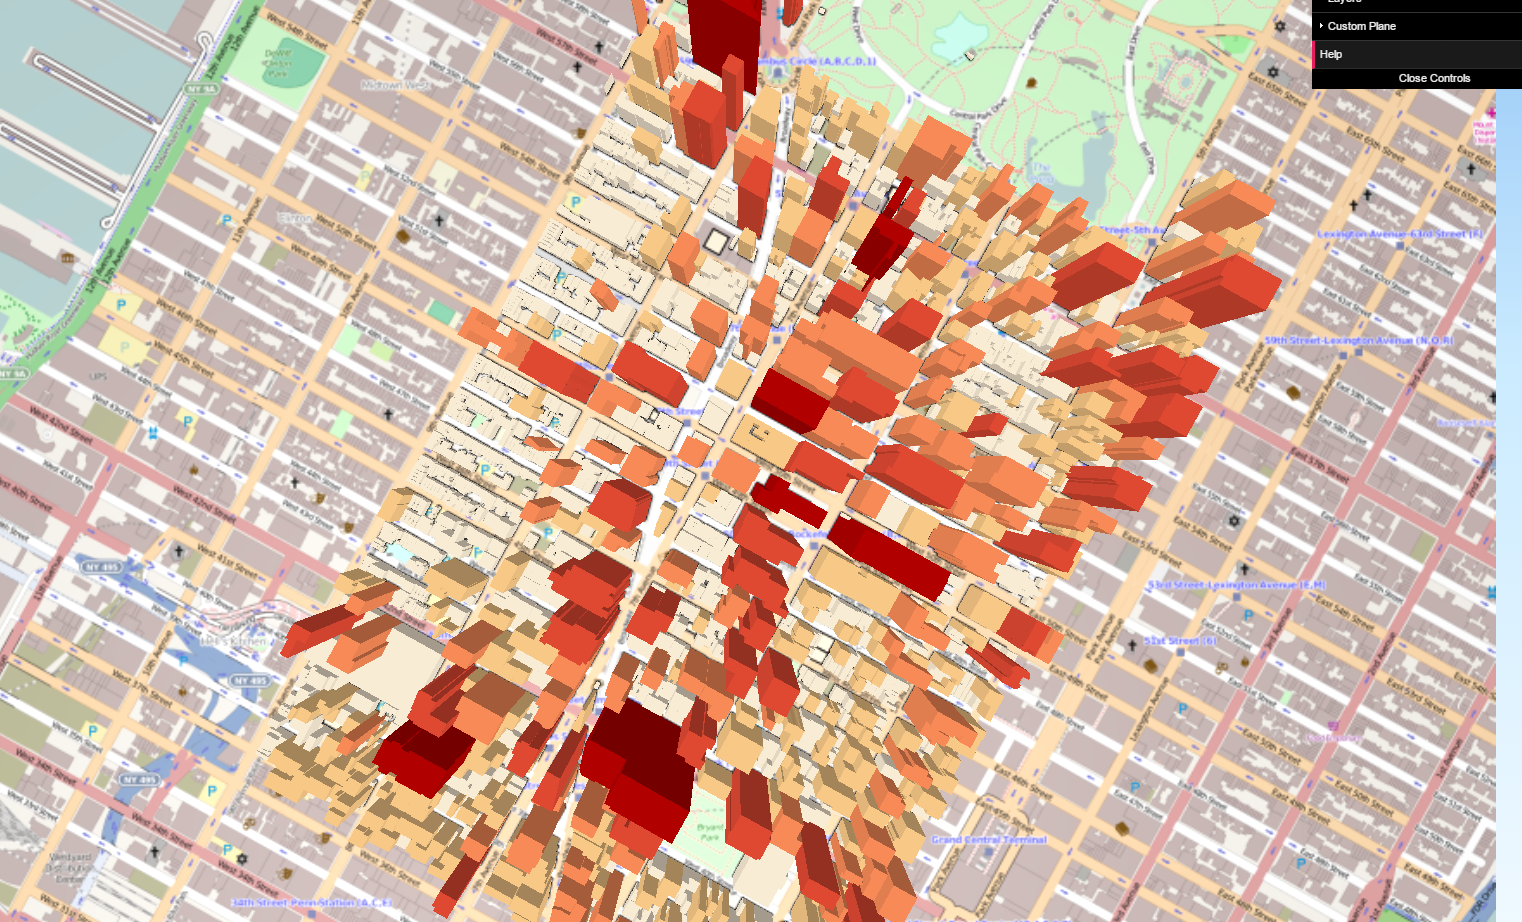
Result from changing the camera position - now overhead view and close-up.

Qgis2threejs.css: Changing the starting background gradient

Many websites will tell you the color codes to build a new color gradient.  Here, I changed the nice default blue gradient to a burnt orange sky.

Original:
#webgl { background: linear-gradient(to bottom, #98c8f6 0%,#cbebff 40%,#f0f9ff 100%); }

Changed to:
#webgl { background: linear-gradient(to bottom, #FF350D 0%,#FF8B3D 40%,#EFBBAE 100%); }

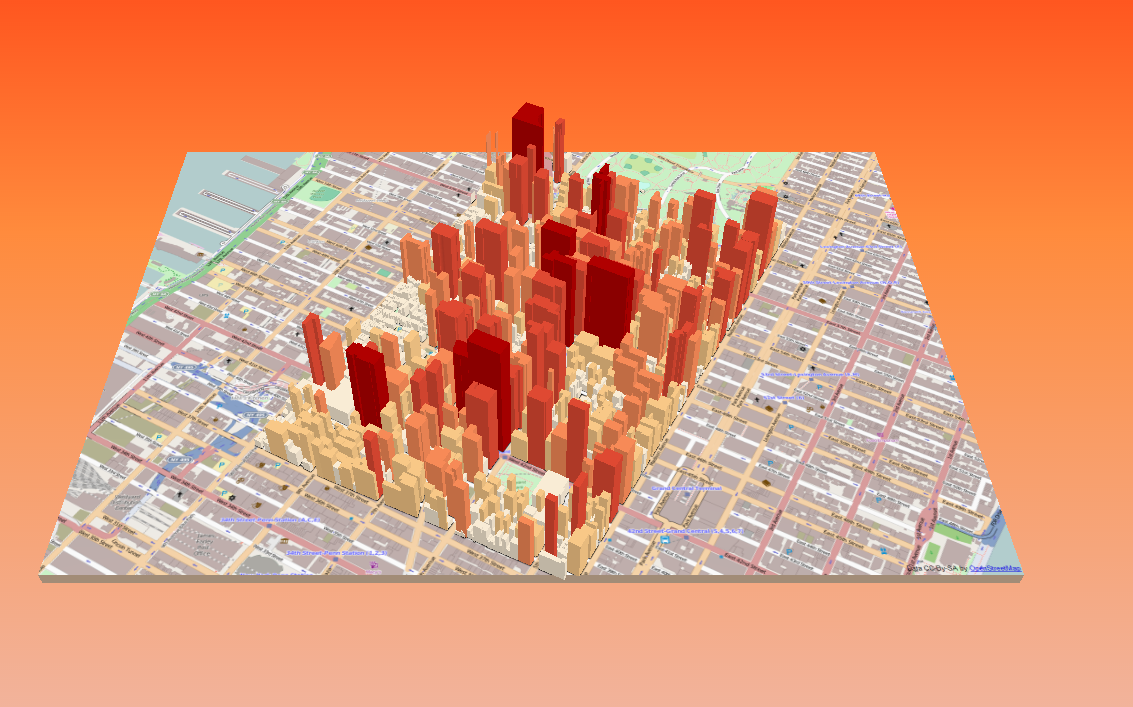
Changing the starting background color is easy to do too!
Within QGIS and the plugin, there are a few basic background options as well, such as making it a solid color.

Additional new features
A number of improvements have been made to the plugin, which is also easier to use.  You can add multiple types of GIS files.  You can also label attributes on your 3D map, although there is a cost to performance.  Labeling lots of features will grind your map to a halt.

Labels can be added now, in this case roof heights

Wednesday, October 8, 2014

An Introduction to Leaflet, Part III: Comparing Heatmap Plugins

A great advantage and disadvantage of free and open source GIS (FOSS GIS) is the variety of options out there.  In this post, we will take a look at four different heatmap plugins for Leaflet.  If you want to skip to the final product, visit: http://webmapexamples.net/leaflet/heatmap/heatcompare.html
to see the final comparison.

We will take a look at four different plugins listed on Leaflet's plugin page:

Screenshot of the comparison site: http://webmapexamples.net/leaflet/heatmap/heatcompare.html
Data
I used QGIS to generate 500 random points within the state of New Hampshire.

Each plugin references point data and intensity/weight values in slightly different way.  For the three plugins I got to work, here are how points should be formatted.
Overall Impressions

Performance: Heatmap.js was fastest. (Although I did not have a chance to use WebGL Heatmap.  HeatCanvas was slowest rendering.

Ease of Use: Heatmap.js was the clear winner! Leaflet-div-heatmap required more knowledge of JavaScript and I ended up editing the actual plugin code.  WebGL required understanding that!

Documentation: Heatmap.js and HeatCanvas were good.  For Heatmap js be sure to visit the website separate from github.  Leaflet-div-heatmap had poor documentation.

Other considerations: I couldn't quite get the WebGL plugin to work - when adding point data. However, I was able to get a demo working and be able to interactively change density using my mouse with another *.html file.  However, WebGL does boast performance for large datasets, so I may return to it a later date.  The Leaflet-div-heatmap uses sort of collect events/morph feature, so it is different from the rest, be sure to zoom in on the map.  This will become clearer when you try it... Also don't forget to check out each plugin and their array of options!

Heatmap Comparison webpage:
http://webmapexamples.net/leaflet/heatmap/heatcompare.html

See also:
Leaflet.heat
SimpleHeat
Leanpub: Leaflet Tips and Tricks
A related post in Stackoverflow