Showing posts with label LIDAR. Show all posts

Thursday, September 3, 2015

Tips for Using LIDAR and LAStools in QGIS

LIDAR is an important technology that is undergoing continuous and expansive growth and predicted to reach $1 billion by 2020.  A recent report also describes ongoing developments in LIDAR in Europe. NOAA has a great one-hour Introduction to LIDAR that I recommend checking out: http://coast.noaa.gov/digitalcoast/training/intro-lidar

Source: Allied Market Research, https://www.alliedmarketresearch.com/lidar-market
LAStools is the popular LIDAR processing tool created by the developer of *.las and compressed *.laz formats.  There is a standalone program as well as toolboxes for a variety of programs including QGIS. We will cover a few tips and wrap up with a look at Wizard Island, Crater Lake, Oregon.

Linking LAStools with QGIS
Linking the two has gotten much simpler since QGIS 2.4.  Simply download the *.zip file from: http://lastools.org/download/lastools.zip.  Unzip the file, and copy and past the LAStools folder into a simple directory like "c:/" If you have QGIS running, close it before proceeding.

Tip #1: Users often copy the folder to a folder pathway that is complex and includes spaces like c:/Program Files/ or c:/My Documents. It will not work. Again, use simple path names, no spaces!

Tip #2: This also applies for any files you import with LAStools or export during processing in QGIS.

After doing this, start QGIS, go to the Processing Toolbar, click "Tools for LiDAR Data"->Activate-> and enter or browse to the folder pathway. I've been using LAStools with the most recent version of QGIS (2.10) and have not had any problems yet.
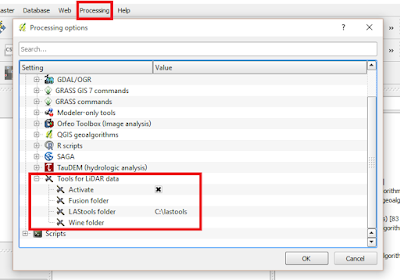
Linking LAStools and QGIS has gotten much easier!
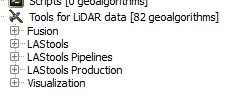
Click "Ok", then head over to the Processing Toolbox side-panel, and you will see the tools ready-to-use!

Expand and see a wide range of tools at your disposal!
Note: The LAStools Production or PRO tools are for batch processing.

Tip #3: If you run a tool and nothing happens, be sure that NONE of the folder pathways, for importing data and exporting results, are complex and/or contain spaces.

Tip #4: Be sure to read the "Log" for important information and troubleshooting.


Tip #5:  When using lasview in QGIS, pressing Space bar changes your ability to navigate from zoom, tilt,pan, and translate.  In the upper-left of the window, you will see the navigation type change as you press it.

Furthermore, right-clicking the mouse, brings up a menu for changing the view of LIDAR, from selecting returns, how to symbolize/color data.
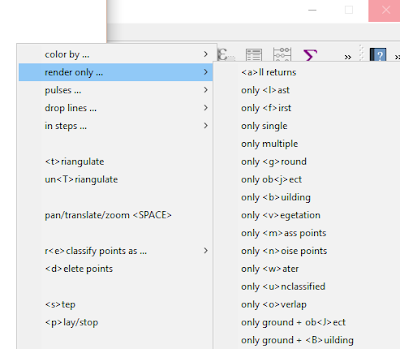
The right click menu in LAStools

Tip #6: To get a 3D view, press Space bar until Pan is displayed, if is not already.  Click and hold your mouse, then move it up to the top of the screen and voila!
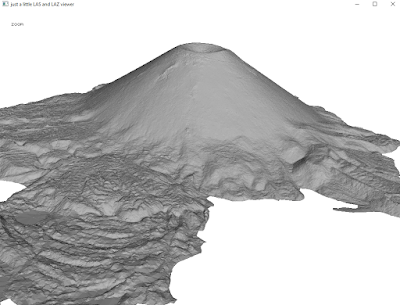

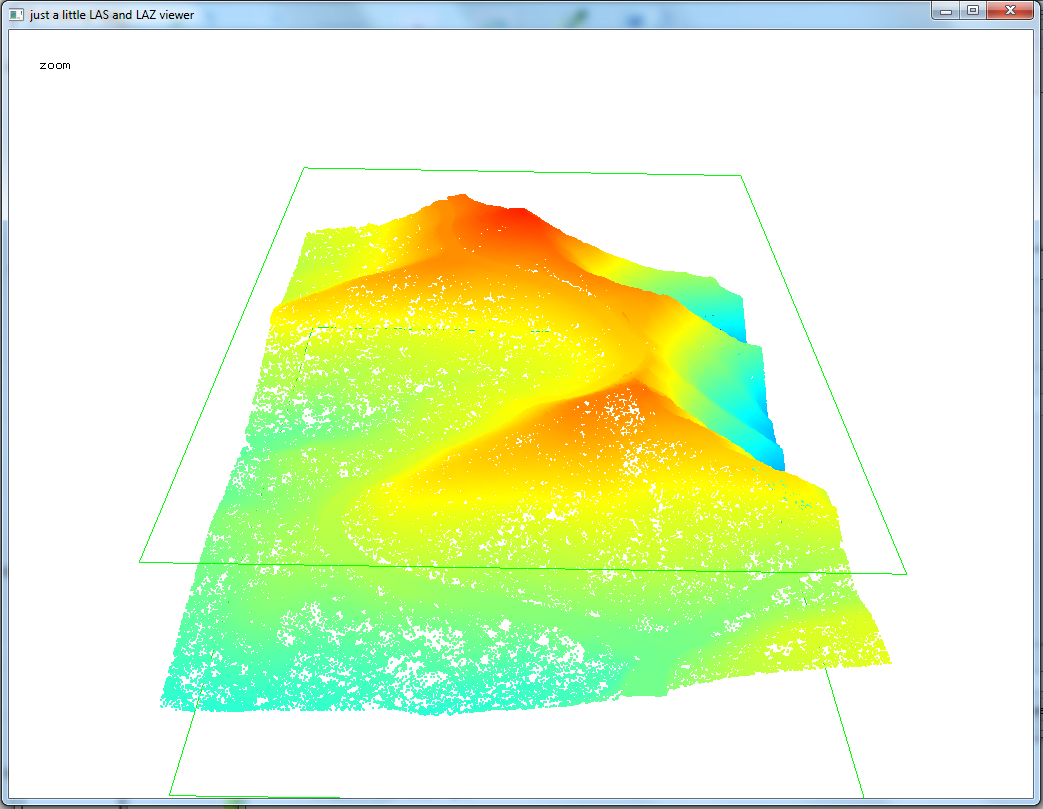
Wizard Island, Crater Lake, Oregon, Data from: Open Topography. lasnoise was also used.
See also:
OpenTopography
Digital Coast
3D Elevation Program
Google search for "County lidar" and State LIDAR

Monday, July 28, 2014

Version 2.0 of 3D FugroViewer Released

Version 2.0 of Fugro's free 3D viewer FugroViewer has been released and includes a few improvements. Head over to their website http://www.fugroviewer.com/ to download it.  The release includes support for compressed LIDAR files or *.laz, created by the open source compression program LASzip.  In addition, there are greater export capabilities and the ability to view 3D shapefiles.  A few months ago, I blogged about using the previous version of FugroViewer to examine LIDAR data of the Luxor Hotel in Las Vegas.

After completing a brief form on Fugro's website, you will immediately receive an e-mail with links to download the program and sample data.  The program is small, and sample data sets, which can downloaded individually, range from 30 to 155 MB.

One sample data set is LIDAR data from Baltimore City and includes Baltimore's baseball stadium: Oriole Park at Camden Yards and the Inner Harbor. Reference imagery can be added by going to the "File menu" and selecting "Open Reference File."

Left: LIDAR points overlaying imagery.  Right: 3D view of Camden Yards Stadium

A picture I took at a recent Orioles / O's game.

Another data set is a digital elevation model or DEM from Fugro's GeoSAR/IFSAR/Radar.

A DEM displayed in FugroViewer
Note: Because of its recent release, antivirus programs, such as Norton, may not yet recognize this program and display a warning about a "potential threat."

Monday, June 16, 2014

Open Topography: A Well-Organized and Feature Rich Site

OpenTopography allows users to register, upload, and download high resolution topography data and tools. as well as download it.  It is run by two universities and funded through a National Science Foundation (NSF) grant.  Below is an overview video of the website.  It is important to note the social features at play and its goals of democratizing information sharing and discovery.


Finding LIDAR data is easy on OpenTopography.  Simply navigate on a map, click a point for more information on the data set, or zoom in for the full coverage area.  In addition, there is a list of tools available and links to them at:  http://opentopo.sdsc.edu/gridsphere/gridsphere?cid=tools.  Click on the screenshots below to take a closer look at using the site.  You can draw a bounding box to select an area of interest.

Finding data is a snap.  Currently, the overwhelming majority of the data is for the continental U.S.
While your data request is being processed, you will receive a nicely formatted report with the associated files and their descriptions. You will also receive an e-mail of the same report with links to your requested files.

Example of a Job Report for data for Washington DC.
Well Organized and Data Ready to Download!
Of course, not only is there free data but but also free tools, like LAStools in QGIS, for looking at your data from OpenTopography.

LIDAR data from OpenTopography visualized in LAStools.  Na Pali Coast, Kauai, Hawaii.
Points colored by elevation.  Pressing the space bar allows user to pan, zoom, rotate, etc. with the mouse.

Thursday, February 13, 2014

A Second Free Look at the Luxor Hotel...with LAStools

I took a second look at the Luxor Hotel but this time with LAStools in QGIS.  If you missed the first post, check it out here: http://opensourcegisblog.blogspot.com/2014/01/a-free-look-at-luxor-hotel-in-las-vegas.html

Before I go a step further, it is important to note how to install LAStools into the processing toolbox of QGIS.  Essentially there are two parts: 1) adding a new "Lidar" folder to the QGIS program folder and 2) activating and linking LAStools to QGIS. Avoid placing this folder in any directory with a name that has spaces in its name, for example \My Documents\.

After that, it should be smooth sailing!  It is a really powerful toolbox that integrates well into QGIS.  There is also an ArcGIS toolbox too.

LAStools comes with a lot of different features for viewing and understanding lidar data.  Just a few of them are implemented below. Click on any of the images to magnify them.


                         Using lasclassify...
The same lidar data classified into different categories using lasclassify--and triangulated.


                       Using las2dem and las2iso...
Contours overlaying a raster DEM using las2dem and las2iso.
                         Up close - an impressive view:
The details of the sphinx, including head, front and rear legs, can be easily distinguished.
 

Wednesday, January 22, 2014

A Free Look at the Luxor Hotel in Las Vegas

A while back, I wrote a brief post on FUSION LIDAR viewing software.  In this post, I will use real world data with the FugroViewer, freeware from the Dutch company Fugro.  

I downloaded LIDAR data from EarthExplorer -- focusing on downtown Las Vegas, specifically the pyramidal Luxor Hotel. The hotel's shape is so constraining that it needs specialized elevators, which tilt and shimmy, up to visitors' rooms. Of course, it is noteworthy to mention that LIDAR is also being utilized to search for ancient lost pyramids.

At first glance, the Luxor hotel is hard to pick out.  However, increasing the point display size from the menu helps to highlight its unique shape. Alternatively, I could also have tried turning off some returns or chosen to highlight specific values for different LIDAR attributes. Redder points have higher elevation values.  Click on the screenshots below to magnify them. 

Can you see the Luxor Hotel?
LIDAR points can be converted into TINs to help visualize what we are looking for.  The three panes below show three different views: overhead (left), a cross-section profile (upper right), and 3-D (bottom right).

Left: Overhead view with a view selected with the Profile tool.  Top Right: View from the Profile Tool.  Bottom Right: A 3-D view of the TIN generated from the LIDAR data clearly showing the Luxor Hotel and nearby attractions.

A slightly cleaned up 3-D view of the Luxor Hotel.
Lastly, LIDAR can be used to measure dimensions with great precision and accuracy.  The Luxor Hotel is listed at 107m.  Using the measurement tool, a height of ~ 107m  (104.7m) is calculated.

How tall is the Luxor Hotel?  Here, a quick measurement calculates about 105 meters-close to its actual 107m.
UPDATE on 1/25: I was able to add in imagery in Fugro viewer.  It has to be a single-band georeferenced image.

NEW: LIDAR data with satellite imagery underneath.

Google Street View of the Luxor and surrounding area

See also:
FUSION Viewer
LIDAR Exercises

Wednesday, March 7, 2012

Open Source LIDAR Software

I had never seen or heard of an open-source program for viewing LIDAR data, which is increasingly in use.  I do not use LIDAR in my daily work, so it seemed like an interesting challenge. I hoped to find something simple to be able to load an occasional LIDAR data set for exploring.

There are several extensions and add-ons out there.  After searching, I found FUSION software by the Pacific Northwest Research Station / Forest Service. It is stand-alone software.  A new version was just released in early February 2012.  Recent and continual updates for any open-source software are always encouraging to see and to maintain its relevance. The website includes sample data (for Washington State below) and a well-written manual.

The screenshots show the wide range of graphics that FUSION can produce.  After importing an aerial image/DOQ and the LIDAR data, you select an area of interest, and a new window automatically opens.  One can perform a variety of tasks simply by right-clicking--including generating a canopy surface model and even producing anaglyphs for 3D.  There is even the very appropriately named "Wiggle-Vison."