Monday, March 30, 2015

FOSS GIS Version Checks - March 2015

Keeping software up-to-date is extremely important. Free and open source (FOSS) GIS software are no exception.  Typically, updates bring fixes, better stability, sometimes performance improvements or security patches, and even new features, some of which can be game changers!  Keep an eye on FOSS GIS websites or subscribe to their e-mail listserves to keep up-to-date.

Here's a quick list of a few free and open source GIS programs, related software packages and libraries, and their version numbers.

Desktop GIS
GRASS GIS 7.0.0 LTS
QGIS 2.8.1 Wien LTR
OpenJump 1.8.0

Remote Sensing/Image Processing
Orfeo Toolbox 4.4
Opticks Image Processing 4.12.0

LIDAR
Fusion LIDAR 3.42
FugroViewer 2.0
LAStools (March 2015)

Spatial Analysis
GeoDA 1.6.7
GWR 4.0
SaTScan 9.4.1

Web map development
Leaflet 0.7.3 - an open source JavaScript library for mobile web maps
Open Layers 3.4
GeoServer 2.7.0

QGIS Visual Changelog makes learning about new features a breeze!
Many open source GIS programs have a roadmap, 'wiki', or version log. These exhaustive sources of information can give you the heads-up on when an update will be released and what features the new version may contain.  They also contain lists of bugs, potential fixes, and the progress toward the fix.

Lastly, updates for paid software are also important and sometimes may require you to update your license agreement, depending on when you purchased the software. Additional fees may apply.

Monday, March 16, 2015

Businesses Based on Open Source GIS

Businesses based on free and open source GIS software (FOSS GIS) offer a number of opportunities to owners and clients alike.  Like Red Hat and Linux, these companies offer several services using FOSS GIS.  At least two have their own suite or development tools (Boundless OpenGeo Suite and Cartologic's Cartoview).  These services include: consulting, development, training (sometimes certification/testing), and support.

Of course, these businesses also offer job opportunities 
for those interested in FOSS GIS! 

In today's post, we will look at a sample of companies out there, where they are based, their philosophy, and specific areas of interest.  All businesses that I reviewed offer sample or demo web maps and apps on their websites.  Although the companies are based around the world, they all offer services to clients whether near or far.

New York-based Boundless is the biggest company out there with 45 employees and venture capital financing.  It has its own suite of software OpenGeo Suite and emphasizes interoperability of different combinations of open and paid-software.  Boundless has a big list of big name clients across different sectors.


This same philosophy that GIS tools can come from different realms is also shared by Cartologic based on Giza, Egypt.  They are a team of geospatial IT developers and focus on Business Integration, GIS Mobile Applications, and GeoPortals.  Cartologic offers the free Cartoview an open source web platform for publishing maps.  (I will cover Cartoview in a later post.)

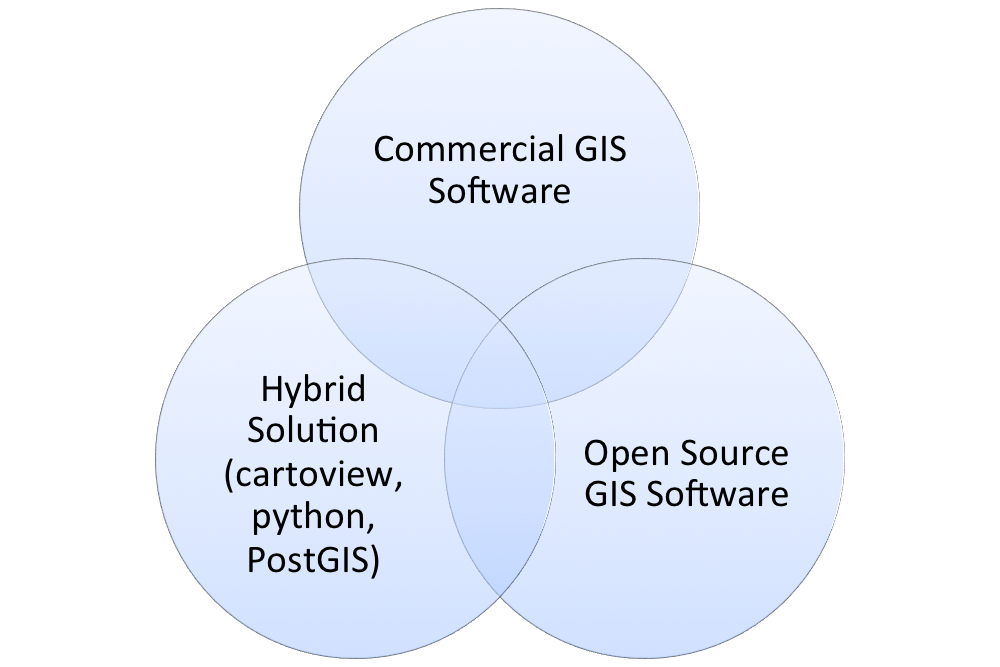
Many businesses recognize that a client's needs
can be met in more than one way, as this diagram
from Cartologic illustrates.
South Africa-based Kartoza was formed as a merger between Linfiniti Consulting (Tim Sutton) and Afrispatial in 2014. Kartoza's key business areas are: Training and Education, Deployment and Support, and Software Development. Kartoza is also a Boundless partner for Southern Africa.

The UK-based Lutra Consulting specializes in flood risk.  Like many of these, businesses, they have given back to the open source community--especially through the creation of QGIS plugins, like AutoTrace.  They are currently crowd funding for AutoTrace 2.

gvSIG Association (SIG is Spanish for GIS or un sistema de informacion geografica).  gvSIG moved from a DOT.org to a DOT.com.  It is located in Valencia, Spain and  is based off of the free desktop and mobile platforms of gvSIG.

The Association raises a new business model around Free Software democratic values, 
based on cooperation and shared knowledge, where part of the generated benefit 
reverts on the strengthening of the gvSIG project. 

NaturalGIS, based in Evora, Portugal, utilizes QGIS and PostGIS/PostgreSQL features services including:  Consulting, Web Development, Training, Data Analysis, Support, and Development.

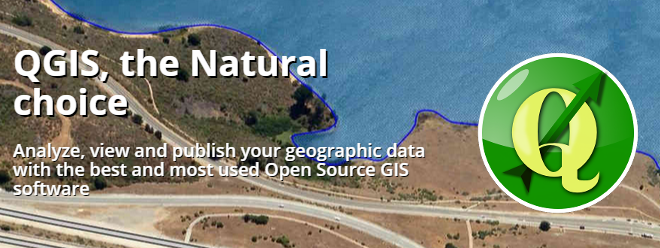
Many businesses, like NaturalGIS, use QGIS as the go-to replacement for ArcGIS.
Businesses that offer commercial support for QGIS:
http://www2.qgis.org/en/site/forusers/commercial_support.html

Contact me
If you are a business based on open source GIS software, I want to hear more about you!  Please leave a link and a little about you in the comment section below.  I am thinking about compiling a list of different companies.

Sunday, March 8, 2015

Spatial Analysis with QGIS - Part I: Point Data

QGIS 2.8 Wien was released, so it is a good time to review QGIS's basic spatial analysis capabilities for vector data--starting with point data. We will also take a look at a few plugins and the SAGA and R processing toolboxes. Most of the functionality in QGIS is from Ftools, formerly a plugin, now part of base QGIS. There is also the MMQGIS plugin to examine vector data.

In addition, I will make a few recommendations for added features, or point you to another free or open source program that can be used in conjunction with QGIS or simply by importing and exporting data.

Nearest Neighbor Index
QGIS can calculate the nearest neighbor index to assess point clustering.  No p-value is given but the simple trick is to remember that large negative z-scores mean the points are clustered while large positive z-scores mean the data is more dispersed.
No p-values are given but remembering critical values/decision points,i.e. +/-1.65, 1.96,
is the easiest way to know if clustering is statistically significant.
Mean Center and Standard Distance
The mean center, an average of x- and y- coordinates, is an easy way to find the central feature and to examine spatial-temporal trends.  In the case below, the mean of all starting points, by year, for US tornadoes, 2000-2013. The data are grouped by UID, in this case a year variable.  It would be great to also be able to calculate a median center.  Data source: NOAA Storm Prediction Center.
  • In some years, the average was pulled slightly west or east.  Interestingly, the mean is pulled east in 2011, when there was a large 'outbreak' of tornadoes across the southeastern US.

The mean of all 'starting' points for US tornadoes, by year, 2000-2013.
Moreover, there are several point pattern analysis tools, including the standard distance--a measure of dispersion--in the SAGA Processing Toolbox.  More specifically the "Geostatistics" tool, contains a lot of useful functions that can be used.  The output can be  saved and displayed in QGIS.  The NOAA dataset already contains the length from start to end, but you could also calculate this by creating a distance matrix in QGIS.


The SAGA Geostatistics Toolbox in QGIS
Ripley's K
Ripley's K helps to determine clustering at different distances.  It can be implemented through the R processing toolbox in QGIS, using R's SpatStat package, or CrimeStat.

Heatmap
You can download the Heatmap plugin or use a built-in live/dynamic heat map when you go to style a layer.  For the latter, make sure to move the rendering slider to 'best' for a nice looking heatmap. Here is an example using the dynamic heat map to look at homicides in Philadelphia. Data source: OpenDataPhilly.   In future posts, we will also look at alternatives to heatmaps, like gridding/quadrat analysis.

QGIS has lot of neat options for styling vector data, including a dynamic heatmap
that changes as you zoom in and out.
 (Note: In ArcGIS kernel density tool (not to be confused with point density) remains separate from the base software and has to be purchased through the Spatial Analyst Extension).

Grouping Analysis
Lastly, grouping analysis can be examined using PostGIS, which allows for a wide variety of spatial queries using SQL, or CrimeStat.

Near future...
We will look at spatial analysis of line and polygon data as well joining points for analysis.

GME and ArcGIS
When using ArcGIS, be sure to check out the free windows-based program Geospatial Modelling Environment, or GME formerly 'Hawth's Tools," http://www.spatialecology.com/gme/.  GME has a long list of helpeful commands: http://www.spatialecology.com/gme/gmecommands.htm.