Monday, June 29, 2015

Book Review: PostGIS Essentials

I decided to teach myself PostGIS/PostgreSQL.  The other option was returning to GeoServer, which I started last summer, but I will leave the latter for the fall.

After shopping around and reading reader reviews, I purchased PostGIS Essentials, April 2015 by Angel Marquez. I got a Kindle copy which was $22 on Amazon.  Overall, I recommend it for those, like me, who want to learn PostGIS as a beginner. Having even a little SQL knowledge is also very helpful.  However, the later chapters are for much more advanced users and developing web and desktop applications.

The book covers downloading and installing PostGIS and gives a good quick background on its uses. Next, it illustrates three ways to create a spatial database using: 1) the command prompt, 2) the toolbars or GUI in PostGIS, and 3) a SQL script.  

A great way to learn PostGIS/PostgreSQL
Before covering how to insert data into these tables, the book goes into discussion of projections and how to include these in spatial tables.  It then shows how to manually add this information and also extract it from shapefiles and import it into PostGIS.

Next, we get down to business with creating non-spatial and spatial queries/functions and accessing information from more than one database.  Of course, connecting to PostGIS databases in QGIS is also covered as well as doing spatial queries in QGIS using PostGIS using DB Manager toolbar in QGIS.

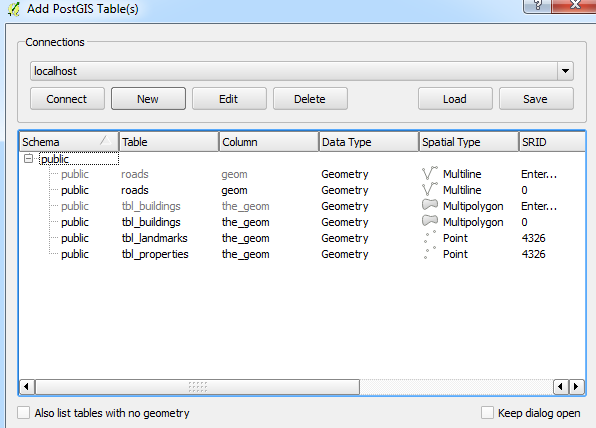
Going from PostGIS to QGIS is a snap!
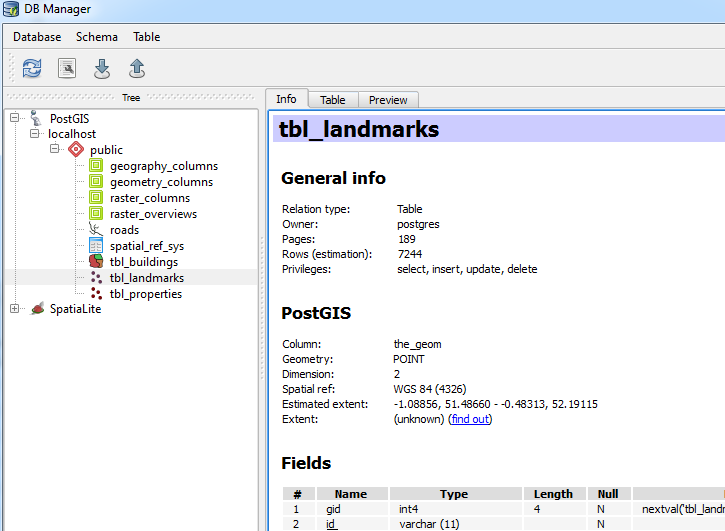
Using DB Manager from the database toolbar in QGIS.

You will also find information on GDAL, working with raster files.  The last few chapters cover advanced features including performance tuning and spatial indexes, developing web and desktop GIS applications.  The latter uses NASA World Wind.  (Note: I have only had time to skim these chapters.)

A few quick pointers

  • Early on the book assumes the reader knows where to execute SQL queries..If you are a novice like me it takes a minute to realize it is the magnifying glass 
  • ...and how to switch to a different database table when running code on several different ones. 

  • Be sure to check the column names in data from OpenStreetMap, particularly the id column: osm_id vs. id.
Overall, the book is a great resource to have. Like all of Packt's books the code is available to download on their website, or you can type it in yourself, which is my preference.

Disclosures
I bought the copy of this book on my own.  I served as a reviewer for another Packt publication.

Tuesday, June 16, 2015

QGIS vs. ArcGIS: Adding Magnetic Declination

This is a QGIS vs. ArcGIS throwdown.  It has been a while since I did the last one on kernel density and Thiessen polygons.  Recently, I was looking over new QGIS plugins and one in particular caught my eye: the QGIS Magnetic Declination Plugin. Magnetic declination is simply the difference between geographic and magnetic north, caused by the earth's magnetic fields. This difference also changes over time. ESRI has a nice technical article on their blog.

NOAA Historical Magnetic Declination Viewer:
http://maps.ngdc.noaa.gov/viewers/historical_declination/
ArcGIS
Adding a declination diagram in ArcGIS can be a bit tricky. As of version 10.2, there is a template and several tools to assist.  You will need a Standard or Advanced license plus the Production Mapping Extension.

QGIS Plugin
On main toolbar in QGIS, go to Plugins-->Manage and Install Plugins--> and search for Magnetic Declination. After a quick installation, you will see a green and yellow star appear on your toolbar. Click it and you will see the toolbar open below.

You can select a location off a map, such as OpenStreetMap, calculate it and map it!  Best of all, the resulting compass rose and measurements also appear in QGIS Print Composer.  Under the options tab, you can also change the color. I found it helpful to change it to black.

Steps:
  1. Click LON/LAT from map
  2. Choose any options
  3. Press "Calculate" button
  4. Then "Draw Compass Rose"
Screenshot of the plugin, steps, and buttons.

  • Click any of the screenshots below to get a closer look.
Up close example with  declination, true, and magnetic north shown in Greenland
where declination is much greater.
Showing positive, zero, and negative declination in the US.

The plugin is very new but is being updated, so stay tuned!

Update #1
I forgot to mention that you can customize the size/diameter of the compass rose--as large or as small as you need depending on whether you are interested adding it to a small scale map or a large scale map.

Wednesday, June 3, 2015

Mapping Photos with the Leaflet.Instagram Plugin

About a month ago, I posted about accessing Twitter data via R.  Now, I will cover accessing and mapping photos from Instagram using the Leaflet.Instagram plugin which can be found on github: https://github.com/turban/Leaflet.Instagram and Instagram API.

If you want to skip ahead and see the resulting map, then visit: http://webmapexamples.net/instabaltimore.html

Note: The difficulty of this project is moderate to difficult based on the large number of Leaflet plugins and other code that you will have to use.  However, the results are terrific.  There are several different implementations of the code so you have a few options to pick and choose from.

Getting an account...
First, head over to the Instagram page for developers: https://instagram.com/developer/

Leaflet.Instagram Plugin
In addition to the Instagram plugin for Leaflet, you will need to install several other scripts including:
  1. Leaflet 
  2. reqwest
  3. Leaflet.markercluster
  4. jQuery
  5. fancyBox
You will need to ensure that the files are placed in correct directories and referenced correctly in your code.  If you a receiving errors, check to make sure everything is correct!   There are also several CSS files for styling.  Of course, you can find examples of webpages on github to make sure that everything works before trying your own example.

Getting an Access Token
In order to access Instagram, you will need an Access Token.  You will see this in the plugin code. This is different from your user id, etc. found on the Instagram API page.  Several websites will help you generate a token as well.

The Code
Making sure all of the JavaScript libraries are referenced properly is the toughest part.  Otherwise, the code comes down to just three pieces in Leaflet:

  1. Creating a variable for map for the <div> element
  2. Adding a basemap via L.tileLayer
  3. Making a call to the Instagram API which depends on what you want
    1. It can be based on tag, user, location,etc.
The Instagram API is well organized and easy to understand how to retrieve data.
In this case, I retrieved recent results from my Instagram photos.  Other criteria to select photos include: relationships, media, comments, liked, tagged, by location, and geography.

The Results
I created a quick map of photos from walking around Baltimore's Inner Harbor.  Unfortunately, it was cloudy, so I won't be winning any awards for great photos!  Head over to http://webmapexamples.net/instabaltimore.html to see the results! Clicking on the popups will show a larger picture, which is also clickable to take you to the original version on Instagram.

Walla! An interactive map of Instagram photos!
The map updates in real time, so as soon a photo is posted and the webpage refreshed, it appears.  If you want to see another example, head on over to the plugin creator's nice map where you can also see the clustering effect (photos grouped and numbered together) at: http://turban.github.io/Leaflet.Instagram/examples/fancybox.html or see below for the map of photos from Sjernaroy, Norway.