Showing posts with label coursera. Show all posts

Thursday, May 7, 2015

Atlasify Beta Released, Learn About Explicit Spatialization

Explicit spatialization "'spatializes' or 'projects' any object into a pre-defined reference system such as a periodic table, map, or seating chart.  It is being used for exploratory search of the web, specifically Wikipedia, and similar sources of information.   Enter Atlasify, a collaboration between the University of Minnesota and Northwestern University.  The web address is www.atlasify.com or http://spatialization.cs.umn.edu/.

How does Atlasify do this?  Well, it uses semantic relatedness--basically a scoring system to be able to pair and match things that are related.  Visualization options include: mapping/geography, chemistry/a periodic table, politics/senate seating chart, and history/a timeline.

If you are having trouble thinking about this, thats okay!  Let's go through a couple of examples. Be sure to click each map to make it larger.

First an easy one: the geography of nuclear weapons.  Note the key in the bottom right-hand corner. Some countries are obviously more closely related to nuclear weapons (those that have, thought to possess, or are pursuing that technology). 

Some countries are more related to the search term nuclear weapons than others.
Lets look at another example, which is still spatial, but uses senates seat locations.  See the example below which looks at the relatedness between medical marijuana and senate seats.  Some senators are more closely tied to the issue, whether pursing legislation for or against.  Some of those senators even sit near each other or across the aisle.
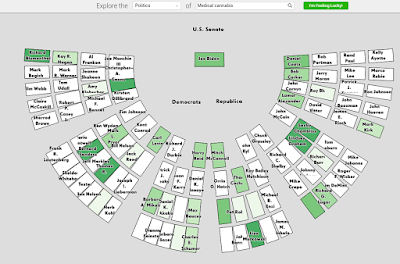
Some senators are more related to the issues of medical marijuana than others.
Lastly, let's look at an example using the periodic table and searching for "rechargeable battery" to see which elements are most related. Elements like Lithium, Nickel, and Cadmium are most related.


Lastly, Atlasify has a little fun gaming component which asks which of two items are more related to certain countries: http://spatialization.cs.umn.edu/game/index.html

Interested learning more about spatial computing? Be sure to check out my review of the Coursera course from the University of Minnesota:http://opensourcegisblog.blogspot.com/2014/12/review-of-spatial-computing-class-on.html.

Sunday, January 25, 2015

Free Five Course Series on QGIS Starts Soon

Del Mar College is offering a free online course that gives an introduction to GIS and QGIS.  The course is titled "Introduction to Geospatial Technology Using QGIS" and is available from the Canvas Network.  The five-week course is self-paced and runs from February 23rd to March 27th. Already 1,000 students are signed up. The courses were created with funds from the National Science Foundation (NSF) and US Department of Labor.

It is great to see a course geared towards QGIS!  The course hits on components of the core competencies for entry level geospatial occupations as outlined here.  It includes lectures and hands-on exercises.  If you can't wait or can't find time, the course materials for this course and others are available at GitHub: https://github.com/FOSS4GAcademy.

From the OSGeo listserve, this course is part of a larger effort to educate about GIS and FOSS GIS called "Geo For All" and GeoAcademy.  This is the first course in a sequence of five, so more courses will be on the way!

The other four courses are:
  • Spatial Analysis Using QGIS
  • Data Acquisition and Management Using QGIS
  • Cartography Using QGIS
  • Remote Sensing Using QGIS
If you know someone who is interested in GIS or QGIS and likes independent study, it looks like a solid opportunity!  
For more information: https://www.canvas.net/browse/delmarcollege/courses/cn-1681-intro-qgis

Course offerings from Penn State University (PSU) and Coursera: 
http://opensourcegisblog.blogspot.com/2014/08/free-online-mapping-classes-from-psu.html

Tuesday, December 2, 2014

Review of the Spatial Computing Class on Coursera

From GPS and Google Maps to Spatial Computing was the first geospatial Coursera course that I took and my second Coursera class. Below, I describe the course, what you'll learn, and key takeaways.  Overall, the course is a unique offering that you should check out!

Overview

The eight-week course is taught by Shashi Shekar and Brent Hecht from the University of Minnesota's Department of Computer Science and Engineering.  The goal of the course is to:
"introduc[e] concepts, algorithms, programming, theory and design of spatial computing technologies such as global positioning systems (GPS), Google Maps, location-based services and geographic information systems."
The class has a workload of 4-10 hours per week depending on which of the three tracks you decide to complete (scroll to the bottom of this post to learn more about the different tracks). The majority of the weeks are close to the four hour end. Week 3's workload was heavy.  Be sure to set aside enough time to watch all of the video lectures each week.

Topics Covered

You will learn why SQL requires extensions for spatial queries as well as how to understand the results from basic spatial queries.  How spatial data are stored, accessed, and algorithms used to solve basic spatial problems (i.e. shortest-path, routing) will be discussed.

You'll also learn about volunteered geographic information, different types of positioning, and even how position can be tracked underground. There are interesting lectures about implicit and explicit spatialization--being able to visualize and analyze spatial information in different ways than you might normally think about. Lastly, you will briefly cover cartography (mainly for those new to GIS and/or computer science focused).

Course Schedule

Week 1: Introduction to Spatial Computing and Overview of Course
Week 2: Spatial Query Languages
Week 3: Spatial Networks (e.g. road networks)
Week 4: Spatial Data Mining
Week 5: Volunteered Geographic Information
Week 6: Positioning
Week 7: Cartography and Geographic Human-Computer Interaction
Week 8: Future Directions in Spatial Computing 

Platforms used: WikiBrain API and briefly TileMill


You will learn about WikiBrain - accessing data from Wikipedia and Atlasify (soon to be released).

Miscellaneous

In addition to lectures/videos and slides, you will see taped/videoconference interviews with leading geospatial professionals. In the first few weeks, I felt this worked well but got a little old as the course went on. Hopefully, future sessions will shorten the interview segments--which can be quite lengthy--and occasionally feel burdensome on top of the other coursework.  You will also have a few required readings that are directly related to the coursework and include interesting real world applications.

Tracks

  • Curiosity:  come as you want! no requirements
  • Concept:  Short quizzes and a Statement of Accomplishment
  • Technical: Harder quizzes and assignments for a Distinguished Statement of Accomplishment
    • For the Technical Track, you will need to complete quizzes for both the Concepts and Technical Track. Having programming experience is recommended for the Technical Track's programming homework.

Signature Track available: Yes.  To learn more about Coursera's signature track visit: https://www.coursera.org/signature/guidebook

You will want to sign-up now for e-mail reminders about future sessions, since Coursera offerings are typically spaced several months apart.  For other geospatial classes on Coursera, visit my earlier post: http://opensourcegisblog.blogspot.com/2014/08/free-online-mapping-classes-from-psu.html.  I will be updating this list in the months to come.  (Please note, like other Coursera classes, it will take several weeks for your Statement of Accomplishment to be posted.)

Tuesday, August 19, 2014

Free Online Mapping Classes From PSU and Coursera

Course dates: Last updated on 12/16/2014

Penn State has an online Open Web Mapping Class for free using open source software.  The course materials are available at: https://www.e-education.psu.edu/geog585/ through a creative commons license. You can also take the paid version of the online course for credit.  Coursework includes QGIS, GDAL, OGR, GeoServer, TileMill, Openlayers, and OpenStreetMap.  Penn State also has several map-related classes on Coursera.

Coursera has at least six relevant classes to GIS, GPS, and more during this upcoming fall 2014 and winter 2015 sessions.  Please note some of the courses do offer different tracts that range from basic to technical in difficulty.  This fall and winter there are exciting course offerings!

Introductory
One course is on Geodesign
Intermediate-Advanced
Another is on GPS, mapping, and spatial computing
Other-related
Also don't forget, ESRI does have some free and low cost tutorials for ArcGIS on their training page as well: http://www.esri.com/training/main.  Be sure to checkout Directions Magazine's articles and webinars for other opportunities.

If anyone else has any that they would like to share, feel free to write them in the comments section below!

Update #1:  Noteworthy addition:  ESRI is offering a free MOOC or massive open online course entitled "Going Places with Spatial Analysis".  Head over to the link below to signup for notification when registration begins, which is shortly: Going Places Signup / Start Page

Friday, January 3, 2014

Happy New Year!...What's Ahead This Year...

What can you look forward to from the Open Source GIS Blog--in the year ahead?  Well I hope to get the New Year off to a good start by finishing some R code for cleaning messy address fields

Most importantly, I will be featuring more ArcGIS vs. Open Source GIS "showdowns/throw downs"--comparing similar features in paid vs. free and open source GIS software, focusing on spatial analysis and other features.  These are one of my favorite posts to write but usually take the most time to create.  Here, you can check out one past post about kernel density in ArcGIS vs CrimeStat. I cannot guarantee open source GIS will win every time, but the journey will be fun!  In addition, we will be taking a look at download and using Landsat 8 data.  I also plan on posting more book reviews on books about open source GIS and other relevant topics.
Announcement:  If you are interested in Android App Development, check out the Coursera course "Programming Mobile Applications for Android Operating Systems" from the University of Maryland.  I will taking it and hope to see you there!  The course is free.  However, Coursera offers a Verified Certificate for $49--which may be worthwhile for professional development.  The course beings on January 21st, and lasts 8 weeks, so if you are interested get registered now!  Check out the video below!


I started this blog about two years ago...this will be third year!  Each year, I try to post higher quality information so stay tuned.  By the numbers, a few statistics:
  • The blog has had a modest 5,700 page views since its first creation in February 2012. 
  • Viewers have come from many different countries. 
    • The most frequent users hail from my home county of the US, Latvia (real or bots/spam?), Germany, UK, Russia, France, Canada, Australia, China, and India.  However, many different countries have viewers including: Brazil, Portugal, and South Korea, and the list goes on! 
  • There have been 56 posts - each with an important piece of information, software, analysis, web map, or links to great resources.
  • By browser: 35% of page views have been in Firefox, 27% from Chrome Browsers, 23% from Internet Explorer, and the remainder from other mobile browsers.
  • By operating system, most users are using Windows (74%), Mac (8%)--with reminder from Linux and mobile OS.
If there is something you would like to see on the blog, feel free to write in the comments below.  Again, happy new year!

Sunday, November 17, 2013

Fighting the MOOCDEMIC with Open Source GIS

The MOOCDEMIC, billed as the world's first online epidemic, is an web-based app that simulates infectious disease dynamics--part of a Coursera course.  Coursera courses are free massive open online courses. 

Moreover, the app is also GIS based and anyone can participate.  Participants "scan" for infection from their present position with a mobile device.  How cases are being seeded or created has not yet made been clear to participants.  So, stay tuned... The course creators also created a game called "Vax" showing differences between vaccination strategies.

The epidemic is about half-way over, at least in terms of course time, and here are a few physical and online maps that I have produced using QGIS and CartoDB. The course instructors have released a basic *.text file of date/times and coordinates for crowd sourced analysis.  CartoDB allows for beautiful maps to be created quickly, has CartoCSS elements, but does not require the expertise and time as other packages such as MapBox/TileMill.

What I chose and why:  I chose to use QGIS as my desktop GIS platform.  In addition, I chose Natural Earth for my base layers.  Using both, I knew that any of my tens of thousands classmates could duplicate my work for no cost.  Furthermore, they maintain accuracy worldwide but keep details to a minimum, so I could work with them quickly.  I did not need to be bogged down with huge layers or downloads. 

The physical maps are below and a link to one interactive map with cases can be found here:  http://cdb.io/17C1sKA.  Click on the maps below to enlarge them.


Week 1 Map: Early in the epidemic...

 
Hong Kong: Generated/fake "cases" appear to be located in
 the water through error or perhaps how they are being generated.