Showing posts with label Orfeo Toolbox. Show all posts

Saturday, August 1, 2015

Tutorial: Side-by-Side Maps in QGIS Print Composer

Step #1: Open New Print Composer
QGIS print composer can be a bit daunting and confusing. It is equivalent to the Layout View in ArcGIS, where users can setup their map for printing and publication. One common task is to create side-by-side maps, to compare imagery, choropleth, or other types of maps.  I looked but could not find a good tutorial with screenshots, so here we go!


Purpose
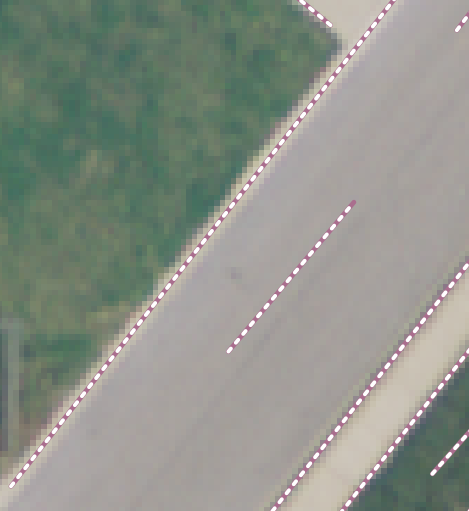
To create three side-by-side maps of different band combinations from Landsat 7 imagery of the Salton Sea. The maps will be exactly the same size.  The different band combinations were created using the Orfeo Toolbox->Image Manipulation->Images Concatenation and selecting various band combinations.

Step #1:  For starters...
I've started by just selecting the natural color view (bands 3-2-1).  Go to the the Project Toolbar in the upper left-> New Print Composer. 

  • You can also can the page layout to landscape or portrait, depending on whether your map series will be laid out horizontally or vertically.

Step #2:  Creating the first map

Click the "Add New Map" button, highlighted in red. and draw an area for your map on the blank page.  For best fit of your image, be sure in QGIS to have zoomed into an area of interest. 


  • Then on the right hand side of print composer, select "Item Properties" and click the long button for "Set to Map Canvas."
After Steps #1-2

Step #3: Add the second map

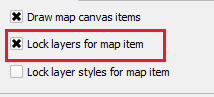
Before adding the second map to the right, scroll up in "Item properties" and check the box for "Lock layers for map item."  The click on the existing map in print composer and copy and paste it. On this second map, be sure to uncheck the box we just checked: Uncheck "Lock layers for map item."


  • In QGIS, add the next layer, in this case I added a false color image from bands 4-3-2.
  • Go back into Print Composer and hit the blue refresh button.
  • The second map should display the false color image and the first map should remain natural color.
After Step #3

Step #4: Repeat for the third map
Before copying and pasting, make sure to check the "Lock layers for map item" box.  Copy, paste, and then uncheck this for the third map, with the last set of band combinations (7-4-2).  The final map appears below.
Click to enlarge the map.
Three side-by-side maps, equal sized, and the same scale.
For more information:
You can find additional tips about using the map composer from multiple frames and different layers in this discussion on StackExchange: http://gis.stackexchange.com/questions/45174/how-to-handle-multiple-map-frames-with-different-layers-in-one-print-layout

Monday, March 30, 2015

FOSS GIS Version Checks - March 2015

Keeping software up-to-date is extremely important. Free and open source (FOSS) GIS software are no exception.  Typically, updates bring fixes, better stability, sometimes performance improvements or security patches, and even new features, some of which can be game changers!  Keep an eye on FOSS GIS websites or subscribe to their e-mail listserves to keep up-to-date.

Here's a quick list of a few free and open source GIS programs, related software packages and libraries, and their version numbers.

Desktop GIS
GRASS GIS 7.0.0 LTS
QGIS 2.8.1 Wien LTR
OpenJump 1.8.0

Remote Sensing/Image Processing
Orfeo Toolbox 4.4
Opticks Image Processing 4.12.0

LIDAR
Fusion LIDAR 3.42
FugroViewer 2.0
LAStools (March 2015)

Spatial Analysis
GeoDA 1.6.7
GWR 4.0
SaTScan 9.4.1

Web map development
Leaflet 0.7.3 - an open source JavaScript library for mobile web maps
Open Layers 3.4
GeoServer 2.7.0

QGIS Visual Changelog makes learning about new features a breeze!
Many open source GIS programs have a roadmap, 'wiki', or version log. These exhaustive sources of information can give you the heads-up on when an update will be released and what features the new version may contain.  They also contain lists of bugs, potential fixes, and the progress toward the fix.

Lastly, updates for paid software are also important and sometimes may require you to update your license agreement, depending on when you purchased the software. Additional fees may apply.

Thursday, August 14, 2014

Image Processing Using Orfeo Toolbox in QGIS

Satellite and aerial images are more than pretty pictures.  Each image contains a wealth of data that can be queried, modified, extracted, and visualized through simple and advanced techniques.  This blog entry will cover a few basic tools in the Orfeo Toolbox in QGIS.  Instructions for installing Orfeo Toolbox in the QGIS processing toolbox can be found be clicking here.  There is also a standalone Monteverdi 2 program.

Quick Background on Orfeo Toolbox
The toolbox, often abbreviated OTB, was created to promote the use of several French satellites.  Like many programs, the algorithms are geared towards popular satellites.  For more on its creation, visit: http://www.orfeo-toolbox.org/otb/about-otb.html.

In QGIS
After following the instructions above, go under "Processing" and make sure the "Toolbox" is selected. You will see Orfeo's tools grouped into what types of functions they perform.

Screenshot of Orfeo Toolbox in QGIS's Processing Toolbox
Feature Extraction, Identification, and Classification
Extracting features from imagery is an extremely powerful tool.  For example, roads can be extracted from imagery.  Edges of images and line segments can be detected.  They can a provide a quick unique source of data for areas large and small.  Click on any of the images below to get a closer look.

Extracted edges of buildings at a college campus.

Line segment detection: In this case the lines of a tennis court (and fencing).
The tan lines are generated by the software.
Line segments differentiating a road, sidewalk, and  nearby grass.
Images can also be searched for specific objects. to automate their discovery. Image classification, groupings based on spectral characteristics, whether supervised or unsupervised, is another post in itself.

Change Detection
Another important aspect of imagery is detecting changes over time, whether something is new, absent, modified, or (re)moved.

Left: Unpainted roof, Center: Roof painted red, Right: Change Detection of Roof
Documentation
Remote sensing and image processing are technical fields.  There is a significant amount of documentation (hundreds of pages) on the Orfeo Toolbox website. A shortened manual and a series of short practical exercises could help to expand its user base.  If you work in remote sensing and image processing, be sure to check out this fantastic resource!