 |
| Users can query several different datasets. |
Moreover, the website allows users to easily select and interact with data across the globe. In addition, a data download tool has recently released. It allows users to download the onscreen data as a square grid in many different commonly used formats (*.kml, tiff, jpeg, csv, xlsx, and shp).
In order to download data, look for the little gift/package button on the right-hand side toolbar--at the bottom.
The three goals of the project are: 1) Analysis and management of climate information, 2) spatio-temporal climate variability, and 3) Applied Climatology.
Lastly, the project uses open source web map development tools including GeoServer and OpenLayers.
For more information, visit the main GCM website at http://www.globalclimatemonitor.org/ or the project page at http://grupo.us.es/climatemonitor/.
 |
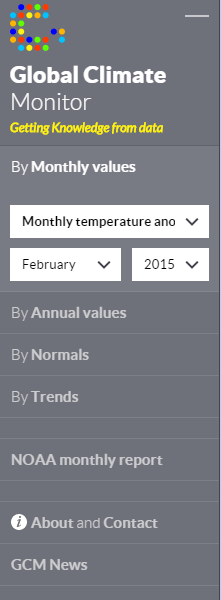
| Above: Monthly temperature anomalies for February 2015. The website allows users to choose a basemap, change transparency of layers, and identify values. |
 |
| The project leverages popular free and open source web map development tools. |
No comments:
Post a Comment